B. Geological, Ground Deformation and Terrain Analysis Maps of specific Regions of Greece
Description
Geological Maps, as well as Terrain Analysis and Ground Deformation Maps of specific Areas of Greece have been created during research studies and projects that have been carried out at NKUA, Faculty of Geology and Geo-environment. Some of these Maps are available in this site.
The Geological, Tectonic Ground Deformation and Terrain Analysis Maps of specific regions of Greece are available in this website in JPEG format as well as in GeoTIFF format.
| Area 1 | Area 2 | Area 3 | Area 4 | Area 5 | Area 6 | Area 7 | Area 8 |
|---|---|---|---|---|---|---|---|
| Argolis Peninsula | Zakynthos Island | Cephalonia Island | Atalanti Fault Zone | Larissa Basin | Nisyros Island |
Area 1 : ARGOLIS PENINSULA
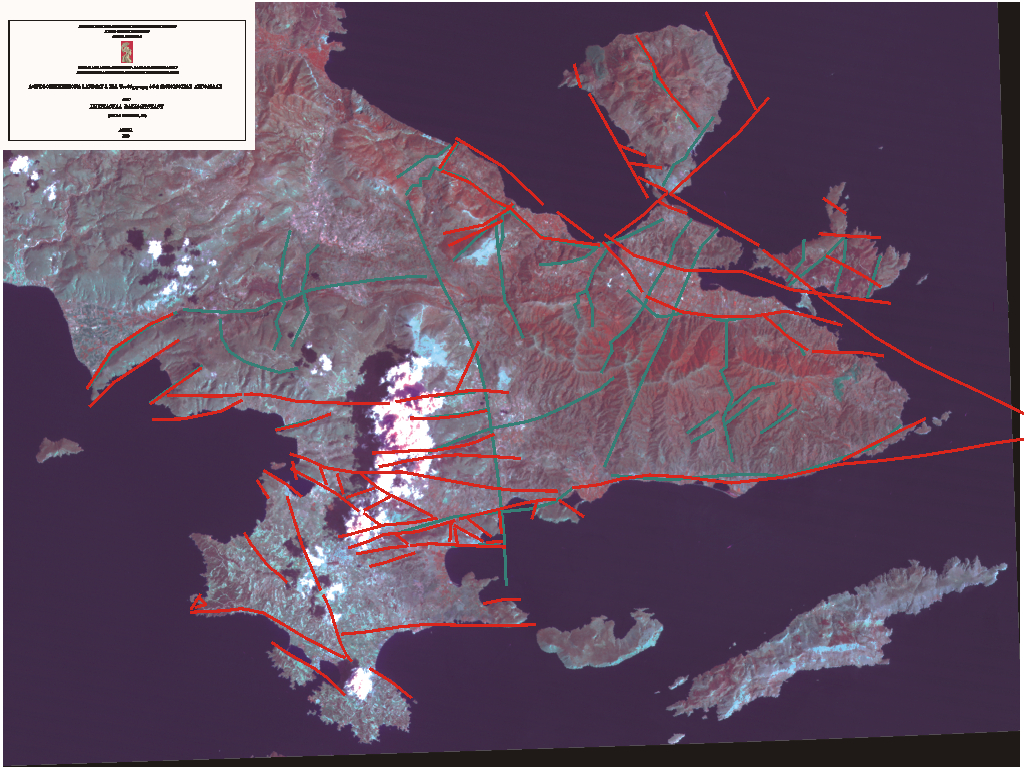
Southern Argolis Peninsula is an interesting Geological and Geomorphological area due to the variety of the geological structures and the interchange on the terrain. Ground and remote sensing data, relating to geology and tectonics, were compiled with terrain analysis data in a GIS data base, in order to perform the morpho-tectonic analysis in the Southern Argolis Peninsula. Terrain analysis data were automatically produced by the specific software “PROANA” (based on ArcGIS). The main direction of Southern Argolis Terrain is E-W. The same direction is observed from the rose-diagrams of morphological discontinuities. The drainage network has a NW-SE main direction. The depositional planation surfaces (0-5%) that are located near the coast are related with neotectonic faults. The direction of the Faulting Zones is mainly ESE-WNW and E-W. The most active tectonic structures were observed to the southern and south-western area of Southern Argolis Peninsula, towards Kranidi and Argolikos Gulf.
Geology
Geological Map of Southern Argolis Peninsula (Fig. 1)

Tectonic Map of Southern Argolis Peninsula (Fig.2)
Terrain Analysis
The relief of Southern Argolis Peninsula presents various structures. Terrain’s morphological peculiarities, among others, basically depend on tectonic phenomena and geological formations. Interesting results can be produced concerning tectonics–morphotectonics–geodynamics etc., of an area, from a close study of the terrain.
Digital Elevation Model of Southern Argolis Peninsula (Fig.3)
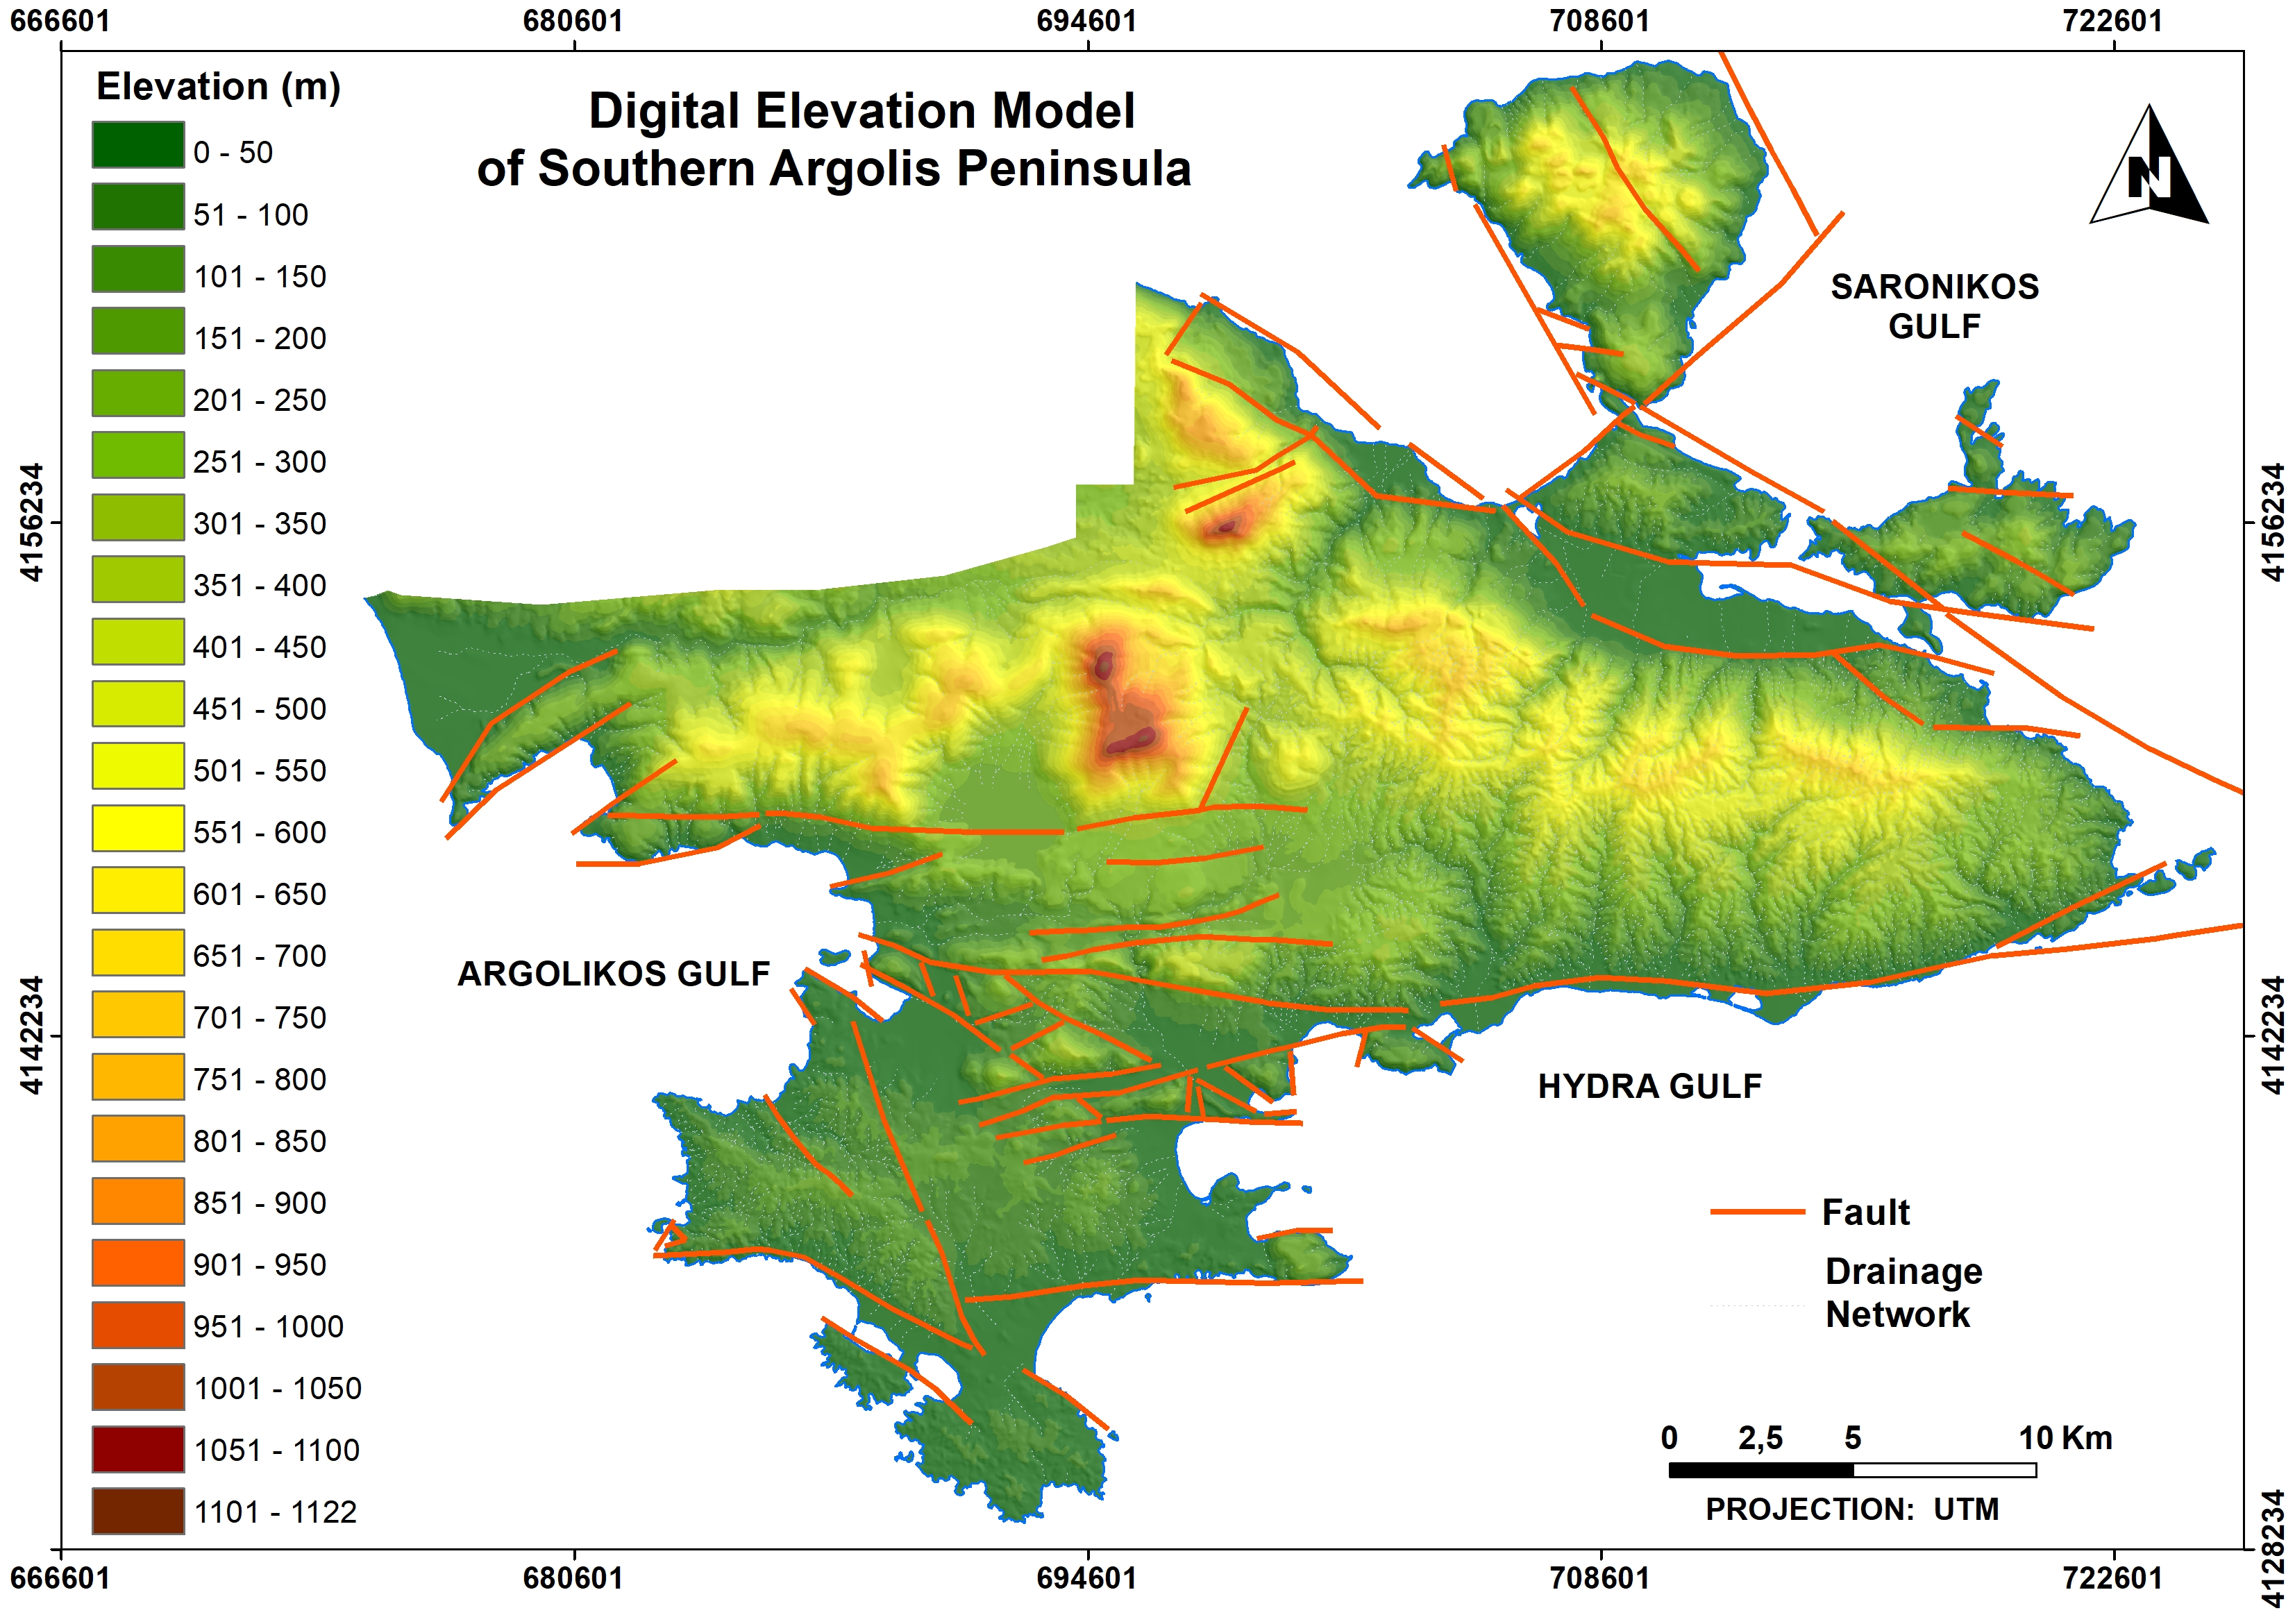
The Shaded Relief of Southern Argolis Peninsula is given. A DEM (20m resolution) was used to produce shaded. This process demands the computation of shaded areas from an assumed solar position. Terrain’s morphological peculiarities (mainly depend on tectonic activity and geology) are observed.
Terrain Analysis Map of Southern Argolis Peninsula (Fig. 4)
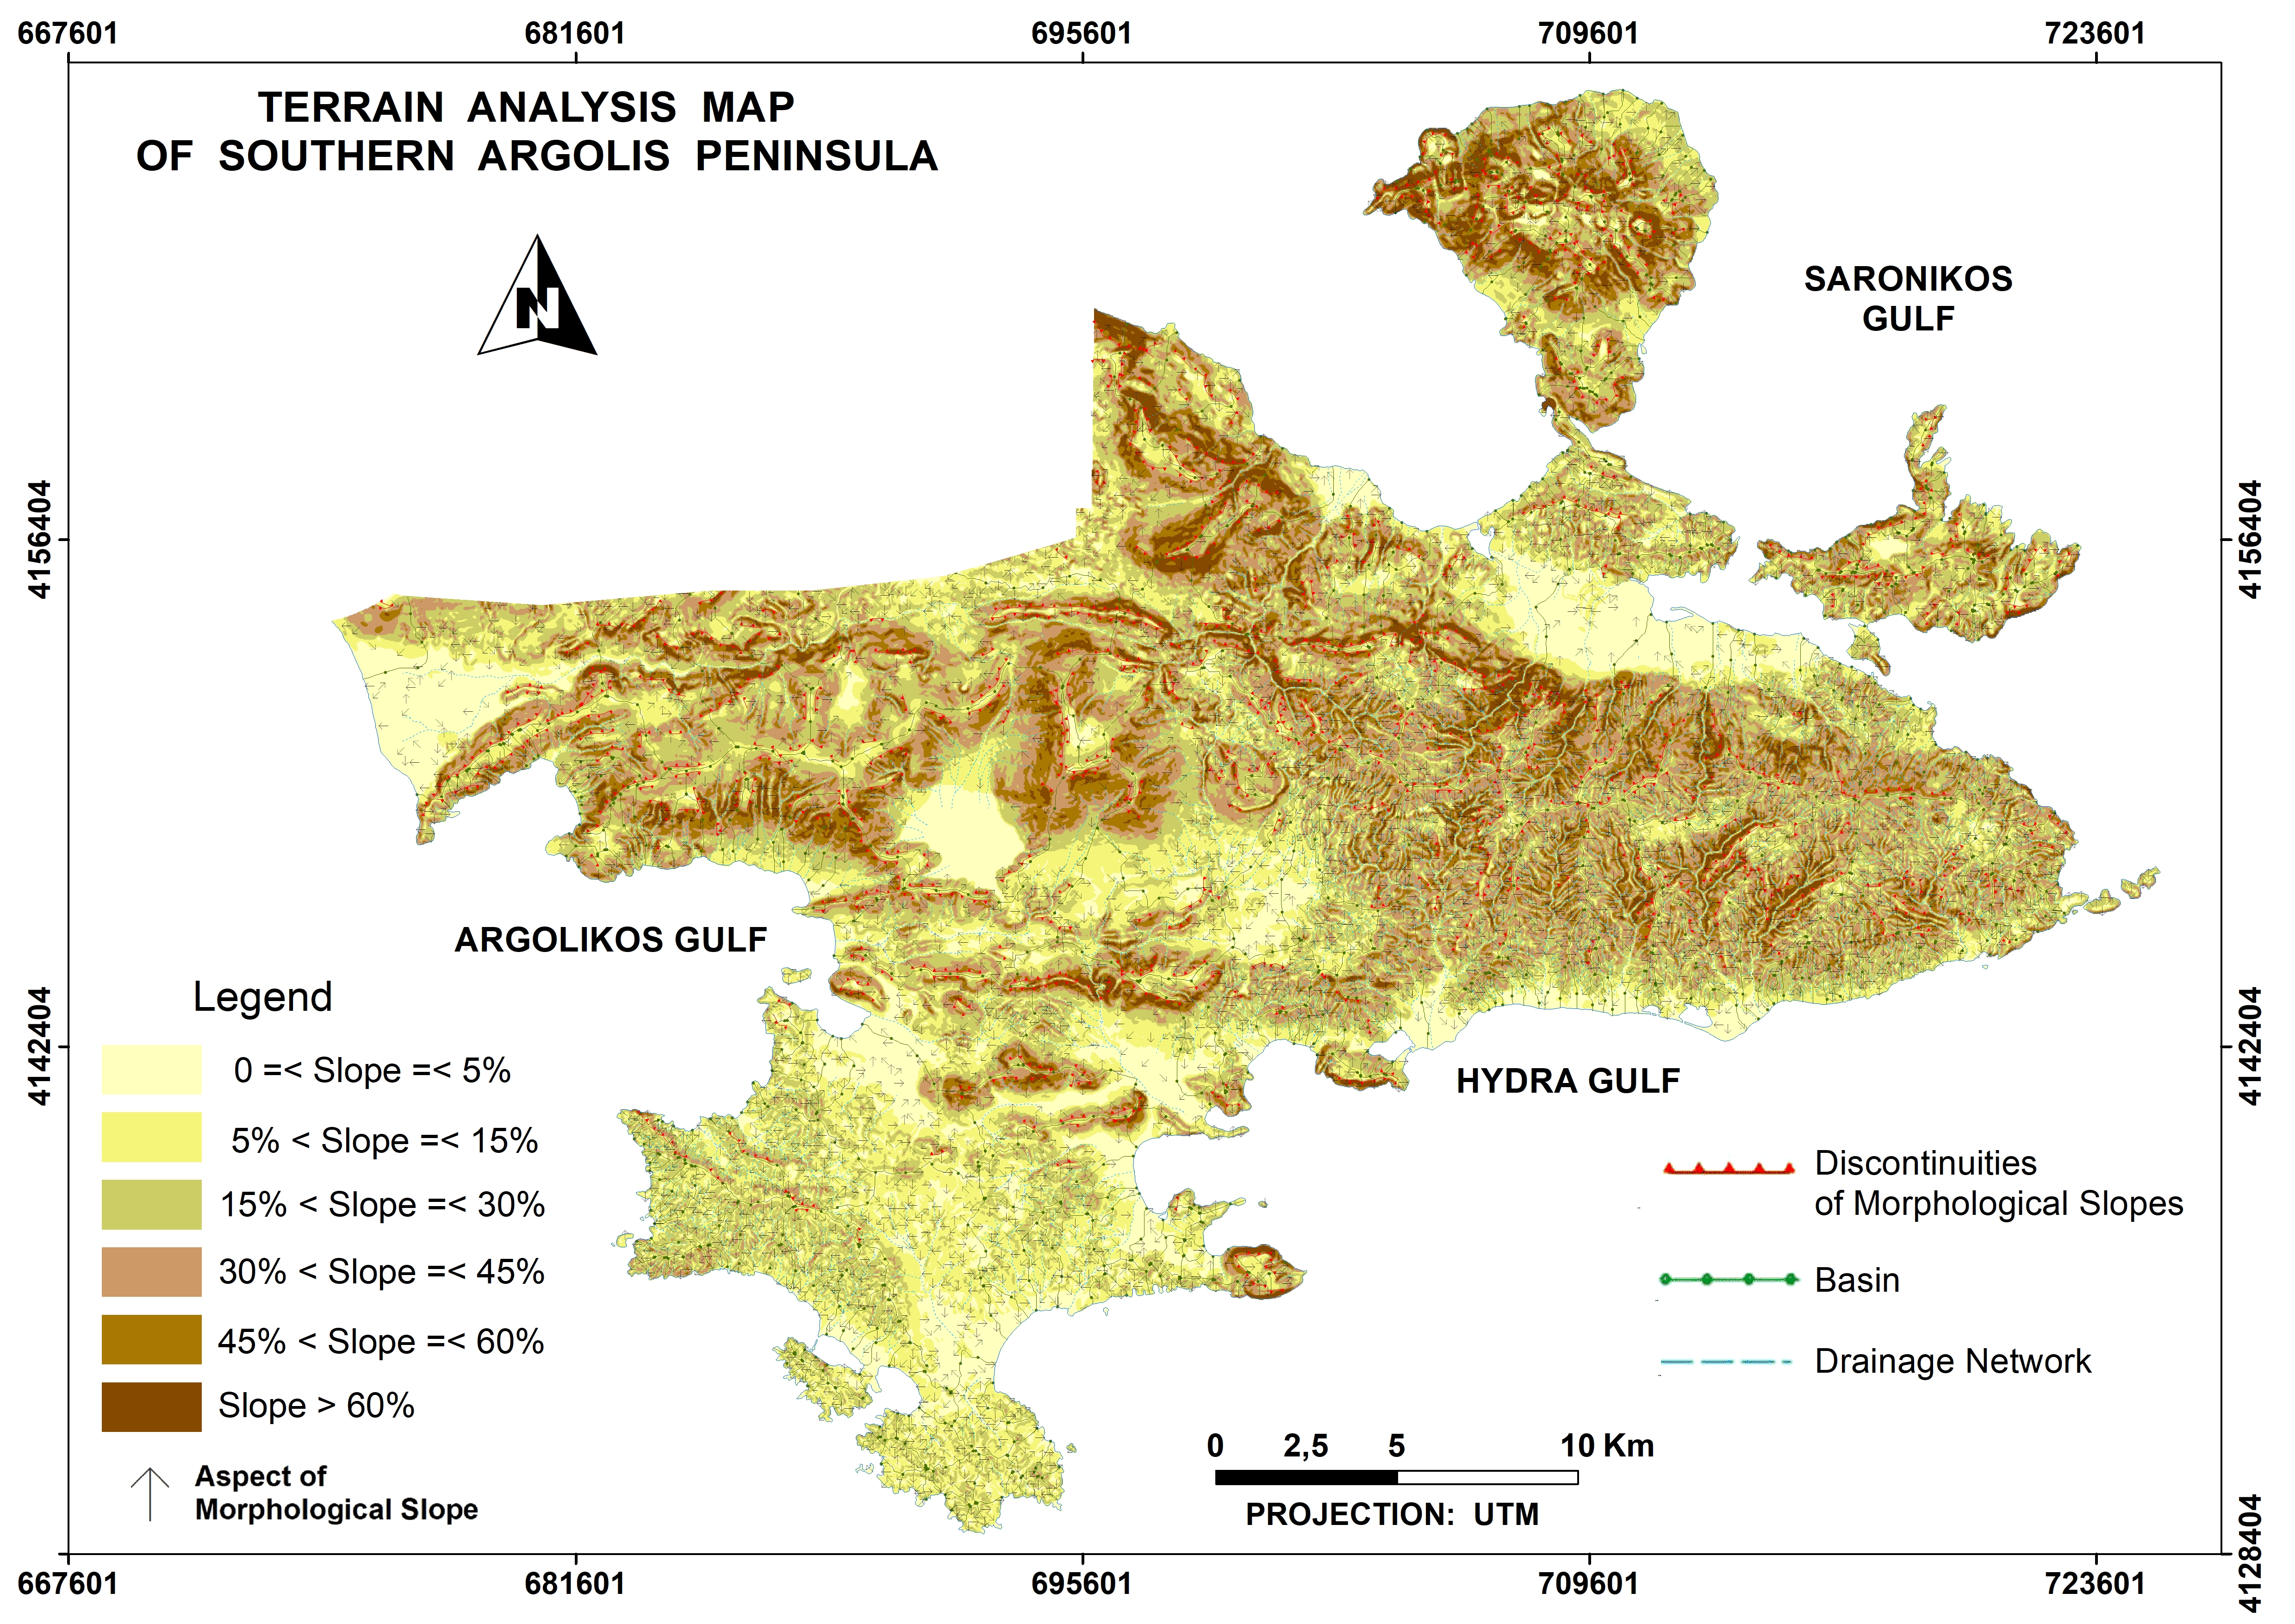
The “Map of Terrain Analysis” is a synthetic Map. It includes all the features for terrain analysis. Specifically it includes all the information of the thematic and synthetic layers of slope, aspect, morphological discontinuities, hydrographic network and watersheds, that where automatically produced from “PROANA”.
Map of Planation Surfaces (Fig. 5)
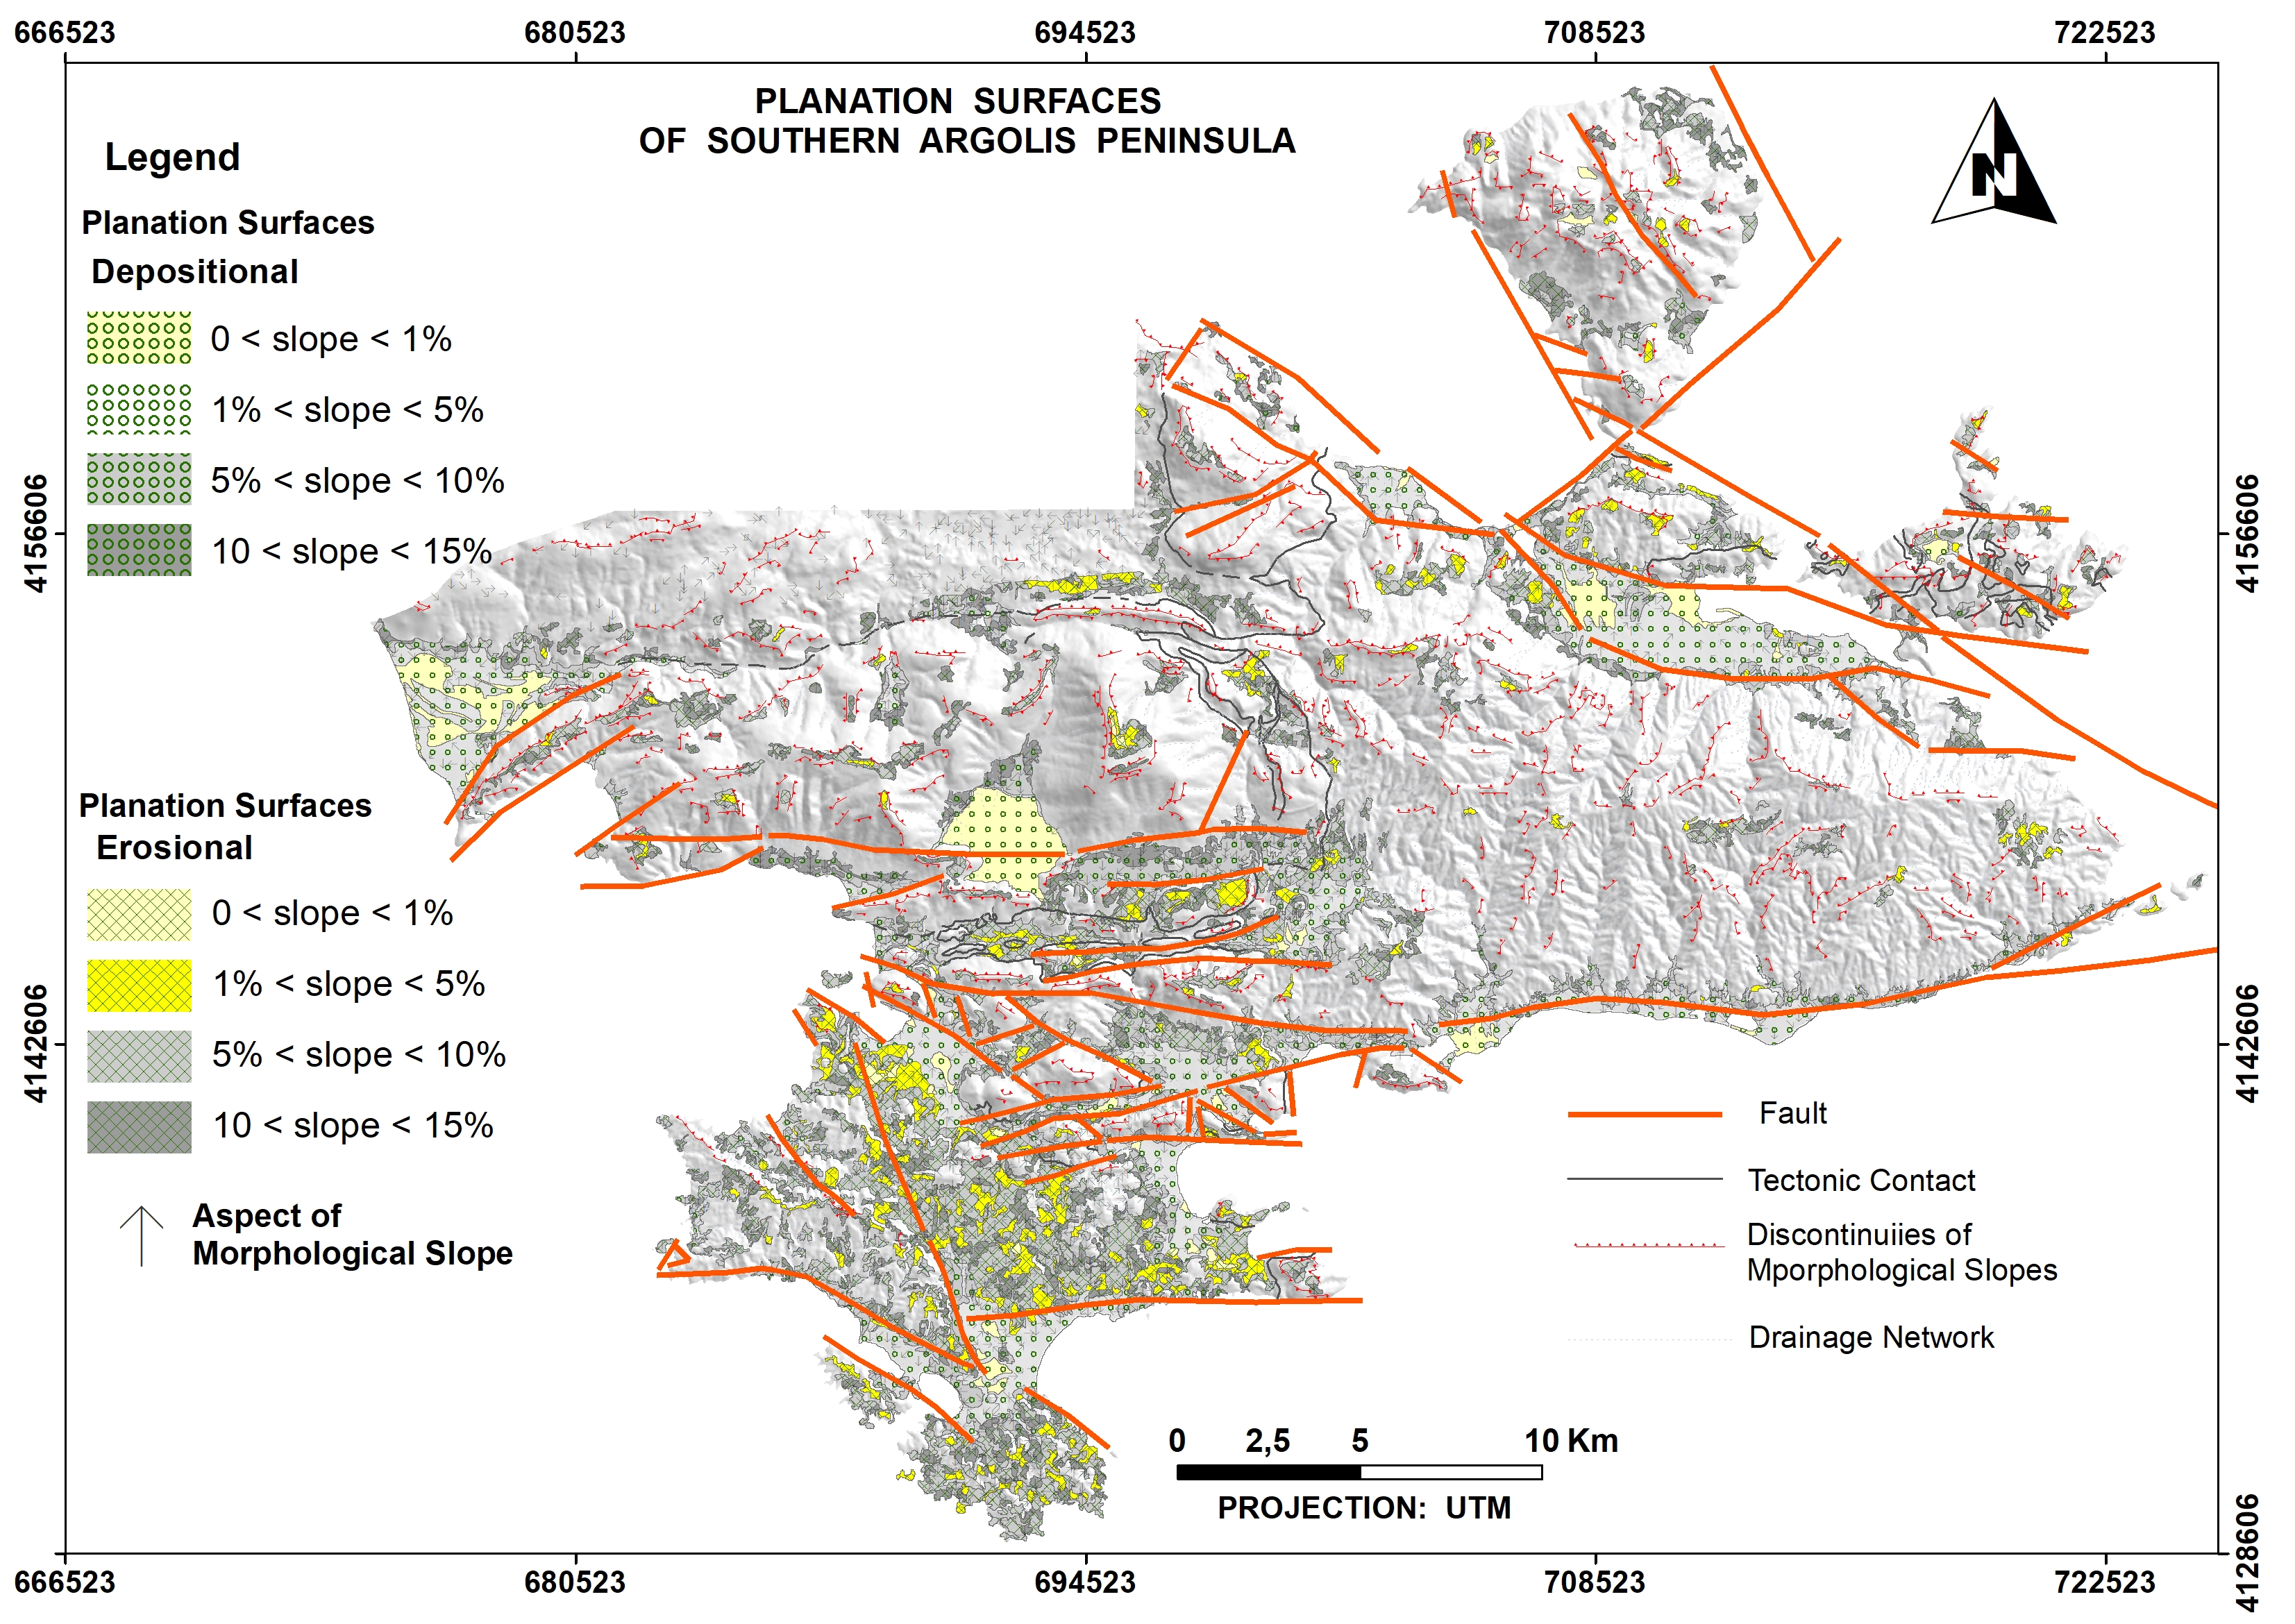
The planation surfaces are regions of the terrain where their slope has values from 0 to 15%. The map is a compilation of the thematic layers of slopes, aspect, range and geology (e) “The Mean Elevation of Planation Surfaces relating to their percentage (%) Area”.
References
Vassilopoulou, S., 2000. Geodynamics of the Argolis Peninsula with GIS development and the use of Remote Sensing Data. PhD Thesis, University of Athens, Faculty of Geology, p. 194.
Vassilopoulou, S. (2001): “PROANA” A Useful Software for Terrain Analysis and Geo-environmental Applications – Study Case on the Geodynamic Evolution of Argolis Peninsula, Greece. Proc. 20th International Cartographic Conference, Beijing, China. Chinese Society of Geodesy, Photogrammetry and Cartography, 3432-3440 (on CDROM).
Vassilopoulou, S. (2010): Morphotectonic Analysis of Northern Argolis Peninsula based on Ground and Satellite Data using GIS Development (Proc. 12th International Congress Geological Society of Greece, Patras, 2010).
Area 2 : NISYROS VOLCANO
The islands of Nisyros, Yali, Kos, Santorini, Milos, Poros, Aegina and the peninsula of Methana constitute the Hellenic Volcanic Arc. The eastern sector of the arc, including the islands of Kos, Yali and Nisyros seems to be geodynamically very active since it comprises the largest volumes of volcanic products and is at present a region of high tectonic unrest. Active volcanoes represent several natural hazards for populated regions. These hazards often occur as combinations of earthquakes, gas-explosions and hydrothermal eruptions, volcanic eruptions, landslides, mudflows, tsunamis etc. For that the research project GEOWARN (2000-2003) financed by the European Union has been established. The objectives of this scientific study are to conduct an integrated informative, volcanological, geophysical and geochemical project to assess volcanic and seismic hazards related in the most active part of the eastern Mediterranean by the help of a GIS database as well as an integrated geo-spatial multimedia system for the region. Eight institutions collaborate in this project and a large amount of heterogeneous information had to be produced and treated. www.geowarn.org
Terrain
Digital Elevation Model of Nisyros Volcano (Fig. 6)
A selection of DEMs of Nissyros Volcano was produced during GEOWARN Project. The basic input data was contours with a good density. Also, as input were points and drainage network. The Topogrid algorithm of Arc/Info with specific parameters related to the study area was applied to a selection of DEMs in grid format, in different scales (from 1:5000 to 1:50000) with various resolutions (cell size from 2 m to 20 m).
The orthorectified IKONOS-2 Image of Nisyros Volcano (Fig. 7)
Ortho-IKONOS-2 Image of Nisyros Island (local datum: HGRS’87). The insert shows the position of Nisyros Island at the eastern end of the Aegean Volcanic Arc.
Topographic Map of Nisyros Volcano (Fig. 8)
Fig. 8. The orthorectified IKONOS-2 satellite image overlaid by the topographic information The orthorectified IKONOS satellite image overlaid by the topographic information (roads, buildings etc.) derived from field work and IKONOS. The update of the topographic map of Nisyros with a final scale of 1:10.000 (scale was changed compared to the original map 1:5000), based on orthorectified IKONOS image.
Land Use of Nisyros Volcano (Fig. 9.)
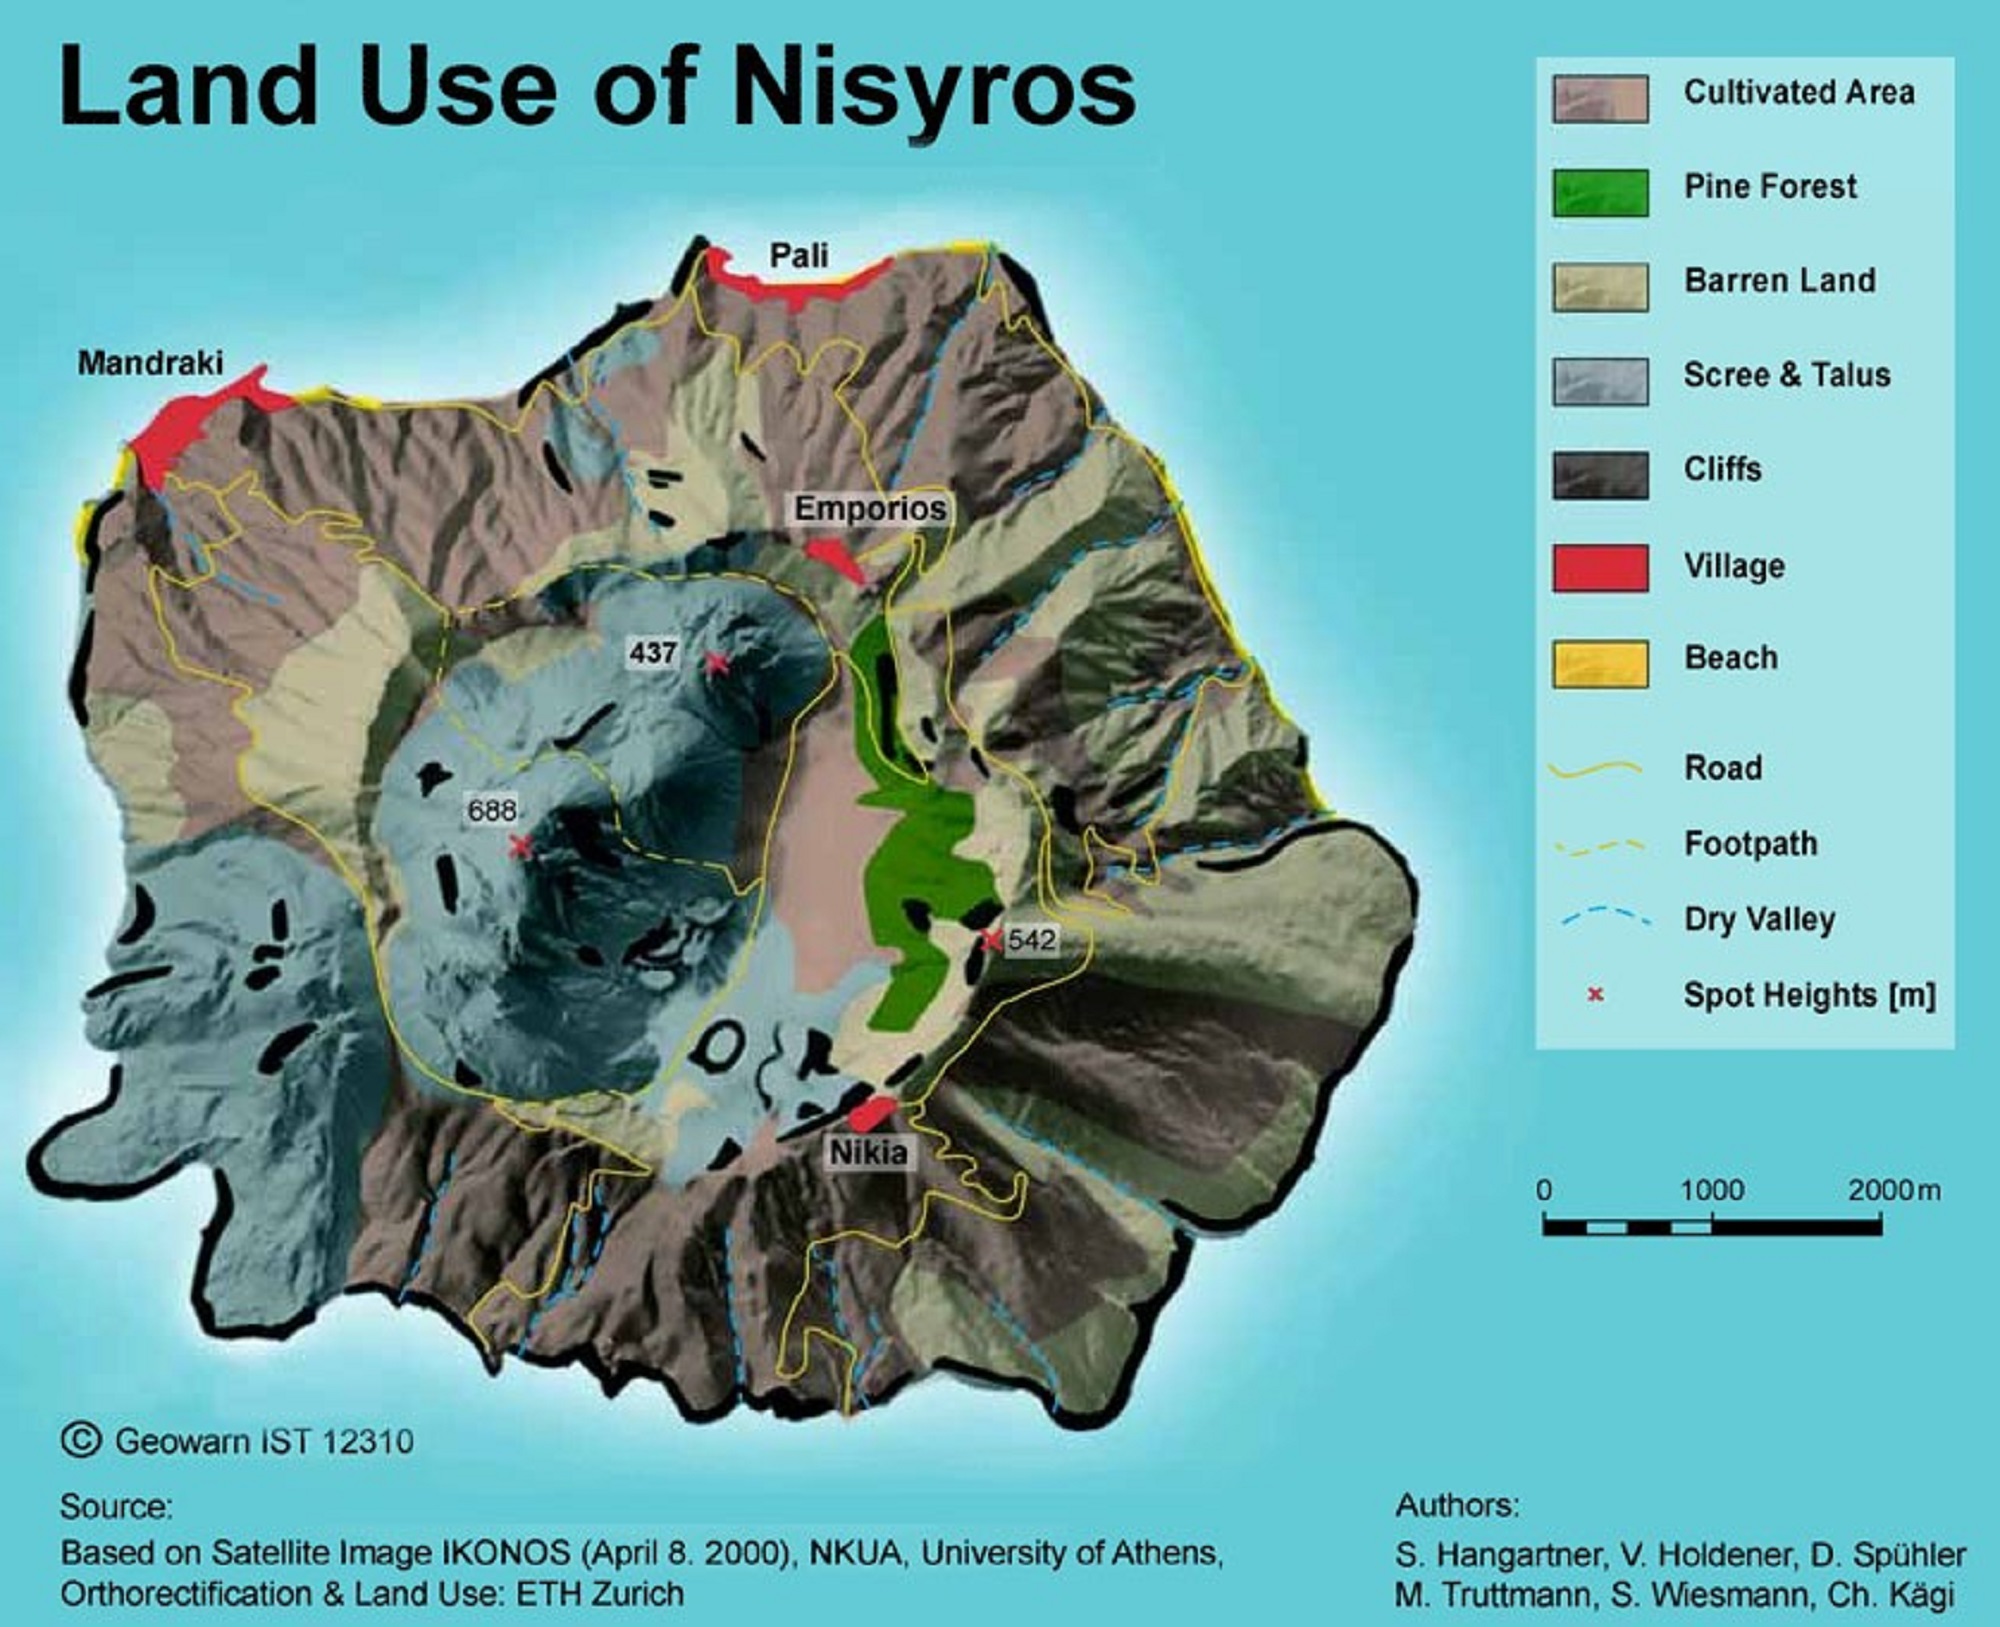
The Land Use of Nisyros Volcano was based on field work and IKONOS-2 Image interpretation.
Thermal Monitoring of Nisyros Volcano
Quiescent but active volcanoes in regions of high geodynamic unrest represent a severe hazard and risk potential and require integrated monitoring, satellite surveying and modelling. Remote sensing from satellites has become a powerful tool in monitoring volcanic fields, Nisyros Volcano was monitored from ground and space during the period 2000-2002. Three night-scheduled LANDSAT-7 ETM+ (band 6) satellite thermal images showing Nisyros Island were processed to obtain surface temperature maps. Ground temperature data were also collected during the satellite overpass. Processing results including ortho-rectification and 3-D atmospheric correction clearly show the existence of a thermal anomaly inside Nisyros Caldera associated mainly with the largest hydrothermal craters with surface temperatures 5 to 10oC warmer than the surroundings. The land surface temperature seems to have generally been increased 2 to 4 oC inside the main crater of the volcano and 1 to 2 oC in Prof. Helias Mt., as well as in the southern part of the island within the period 2000-2002. Ground thermal images of Stephanos Crater were also collected using a portable IR thermal camera during 2002. These images were calibrated to ground temperature measurements and ortho-rectified. A difference of about 0 to 2οC was determined comparing the values of the ortho-thermal images with the observed ground truth temperature data. This satisfactory result constitutes an additional feature for the monitoring of Nisyros Volcano. Satellite remote sensing of the low-temperature fumarolic field in Nisyros Caldera using LANDSAT 7 ETM+ band 6 may be regarded as a reliable monitoring tool of dormant volcanoes on a long-term basis, while the portable thermo-imager can easily be used for real-time remote sensing and telemetric data transfer, with both systems operating at a rather low-cost level.
Ortho-LANDSAT-7 Thermal Images (Fig. 10)
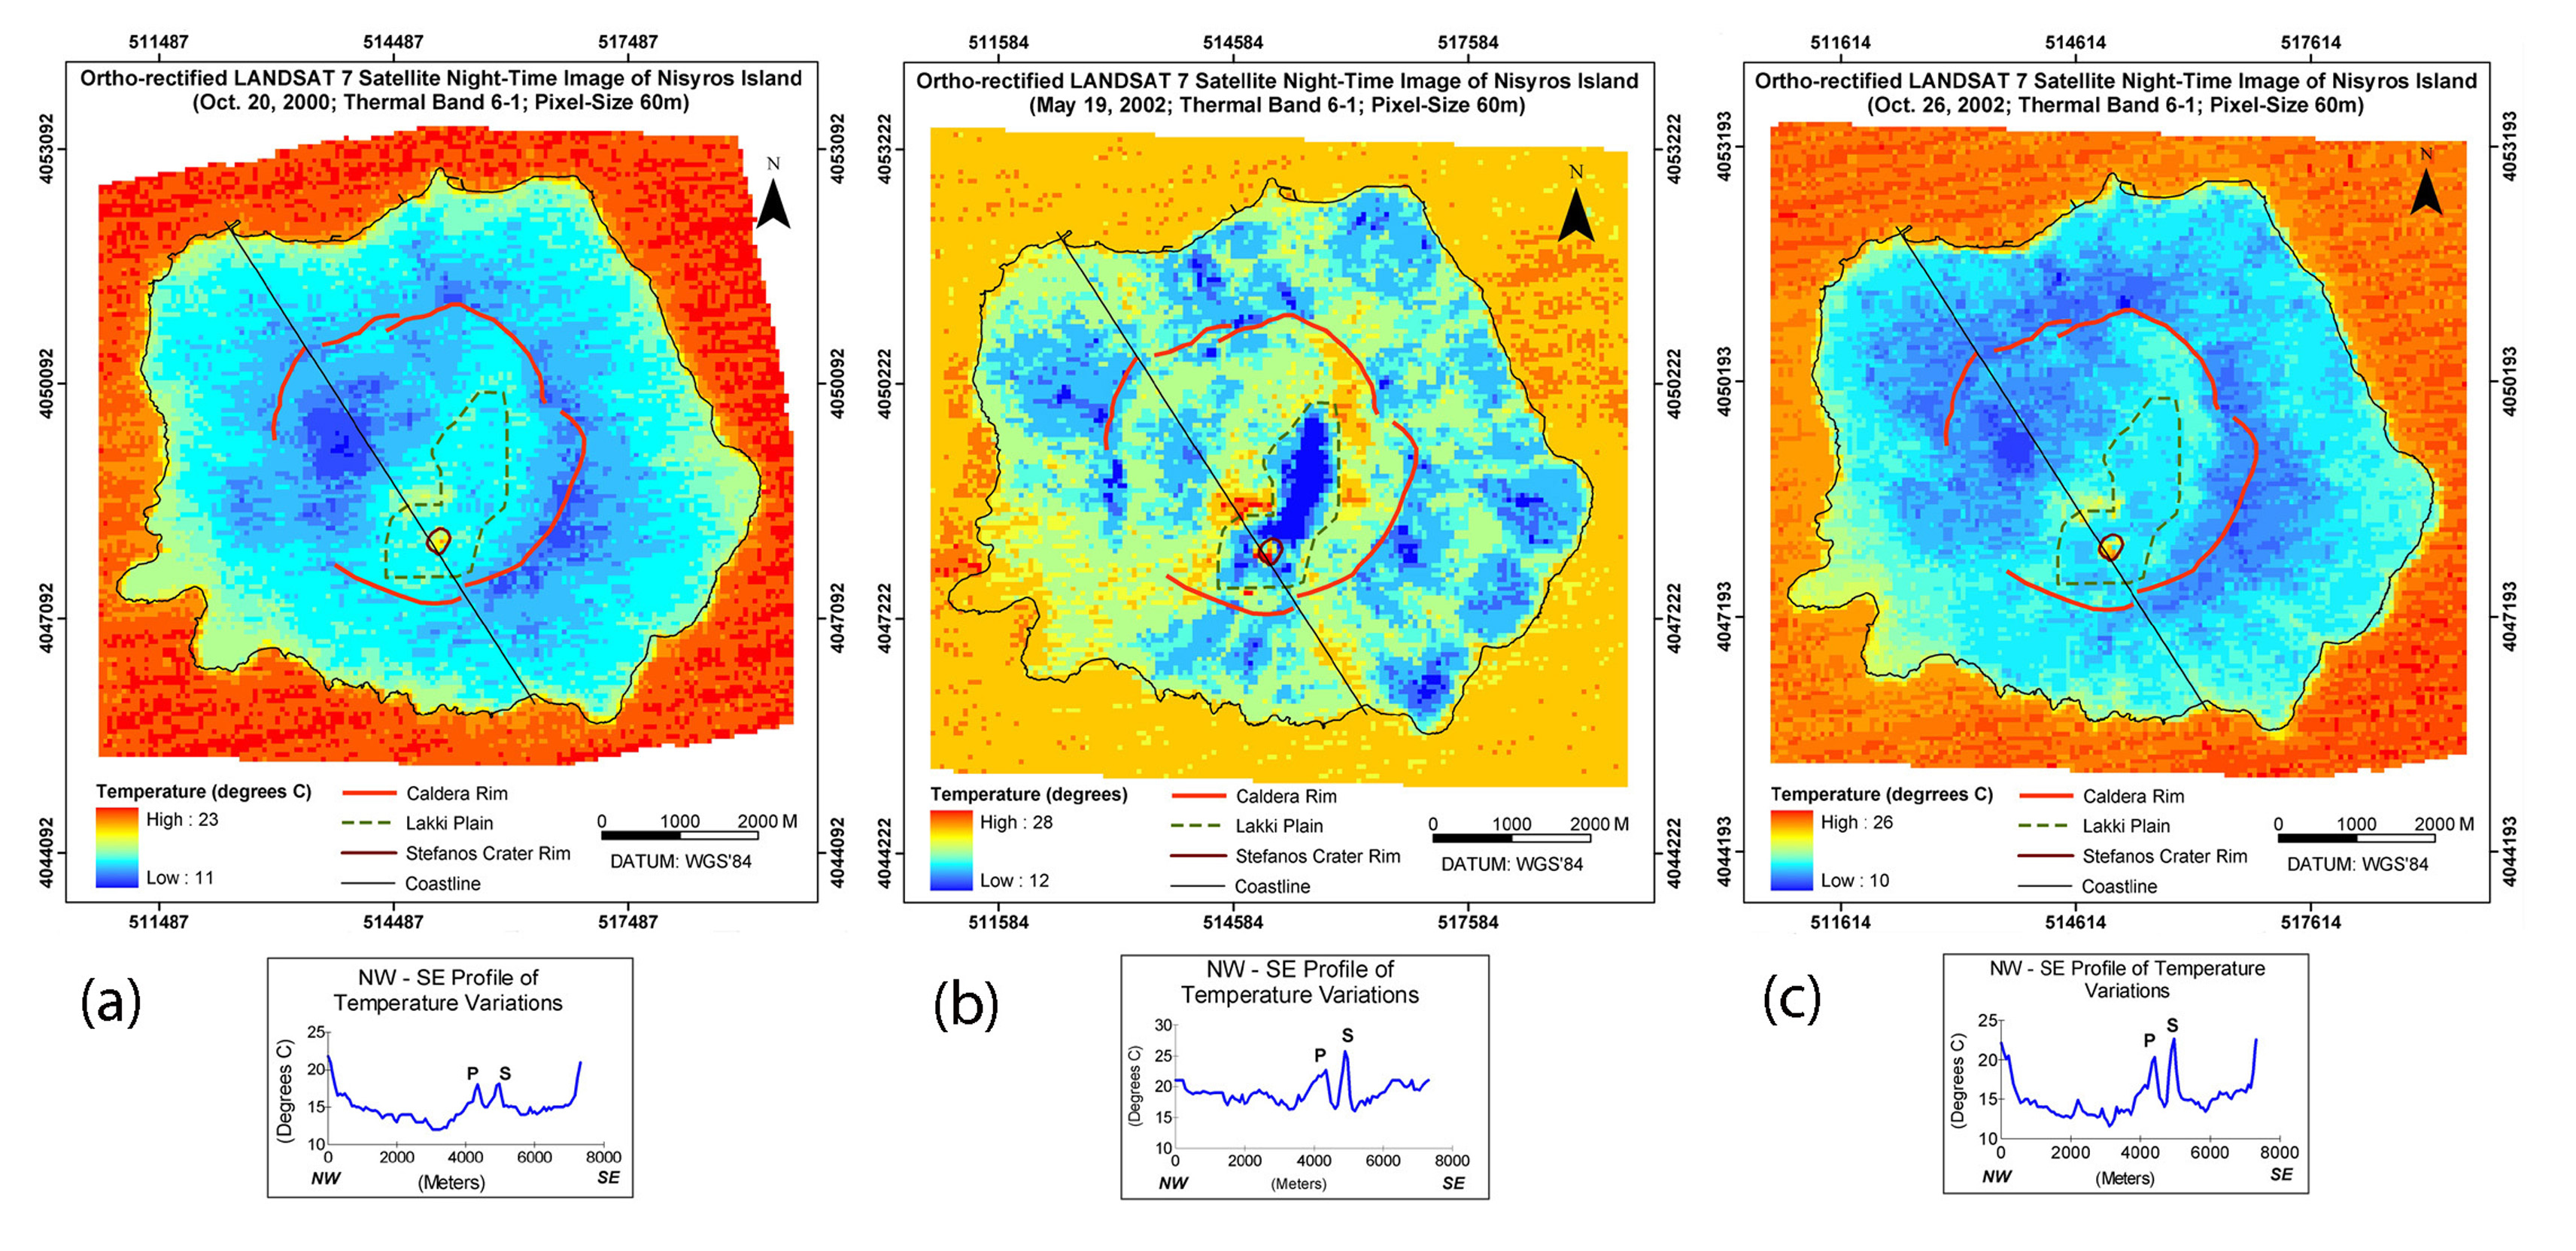 Fig. 10. Ortho-LANDSAT-7 night-time images (a: Oct. 20, 2000; b: May 19, 2002 & c: Oct. 26, 2002) of Nisyros Island. Three areas of higher temperature (Polyvotis Crater (P), Stephanos Crater (S) and southern fumaroles) are identified from NW to SE (lower diagrams).
Ortho-LANDSAT-7 night-time images (a: Oct. 20, 2000; b: May 19, 2002 & c: Oct. 26, 2002) of Nisyros Island. Three areas of higher temperature (Polyvotis Crater (P), Stephanos Crater (S) and southern fumaroles) are identified from NW to SE (lower diagrams).
Surface Temperature Difference Map (Fig. 11)
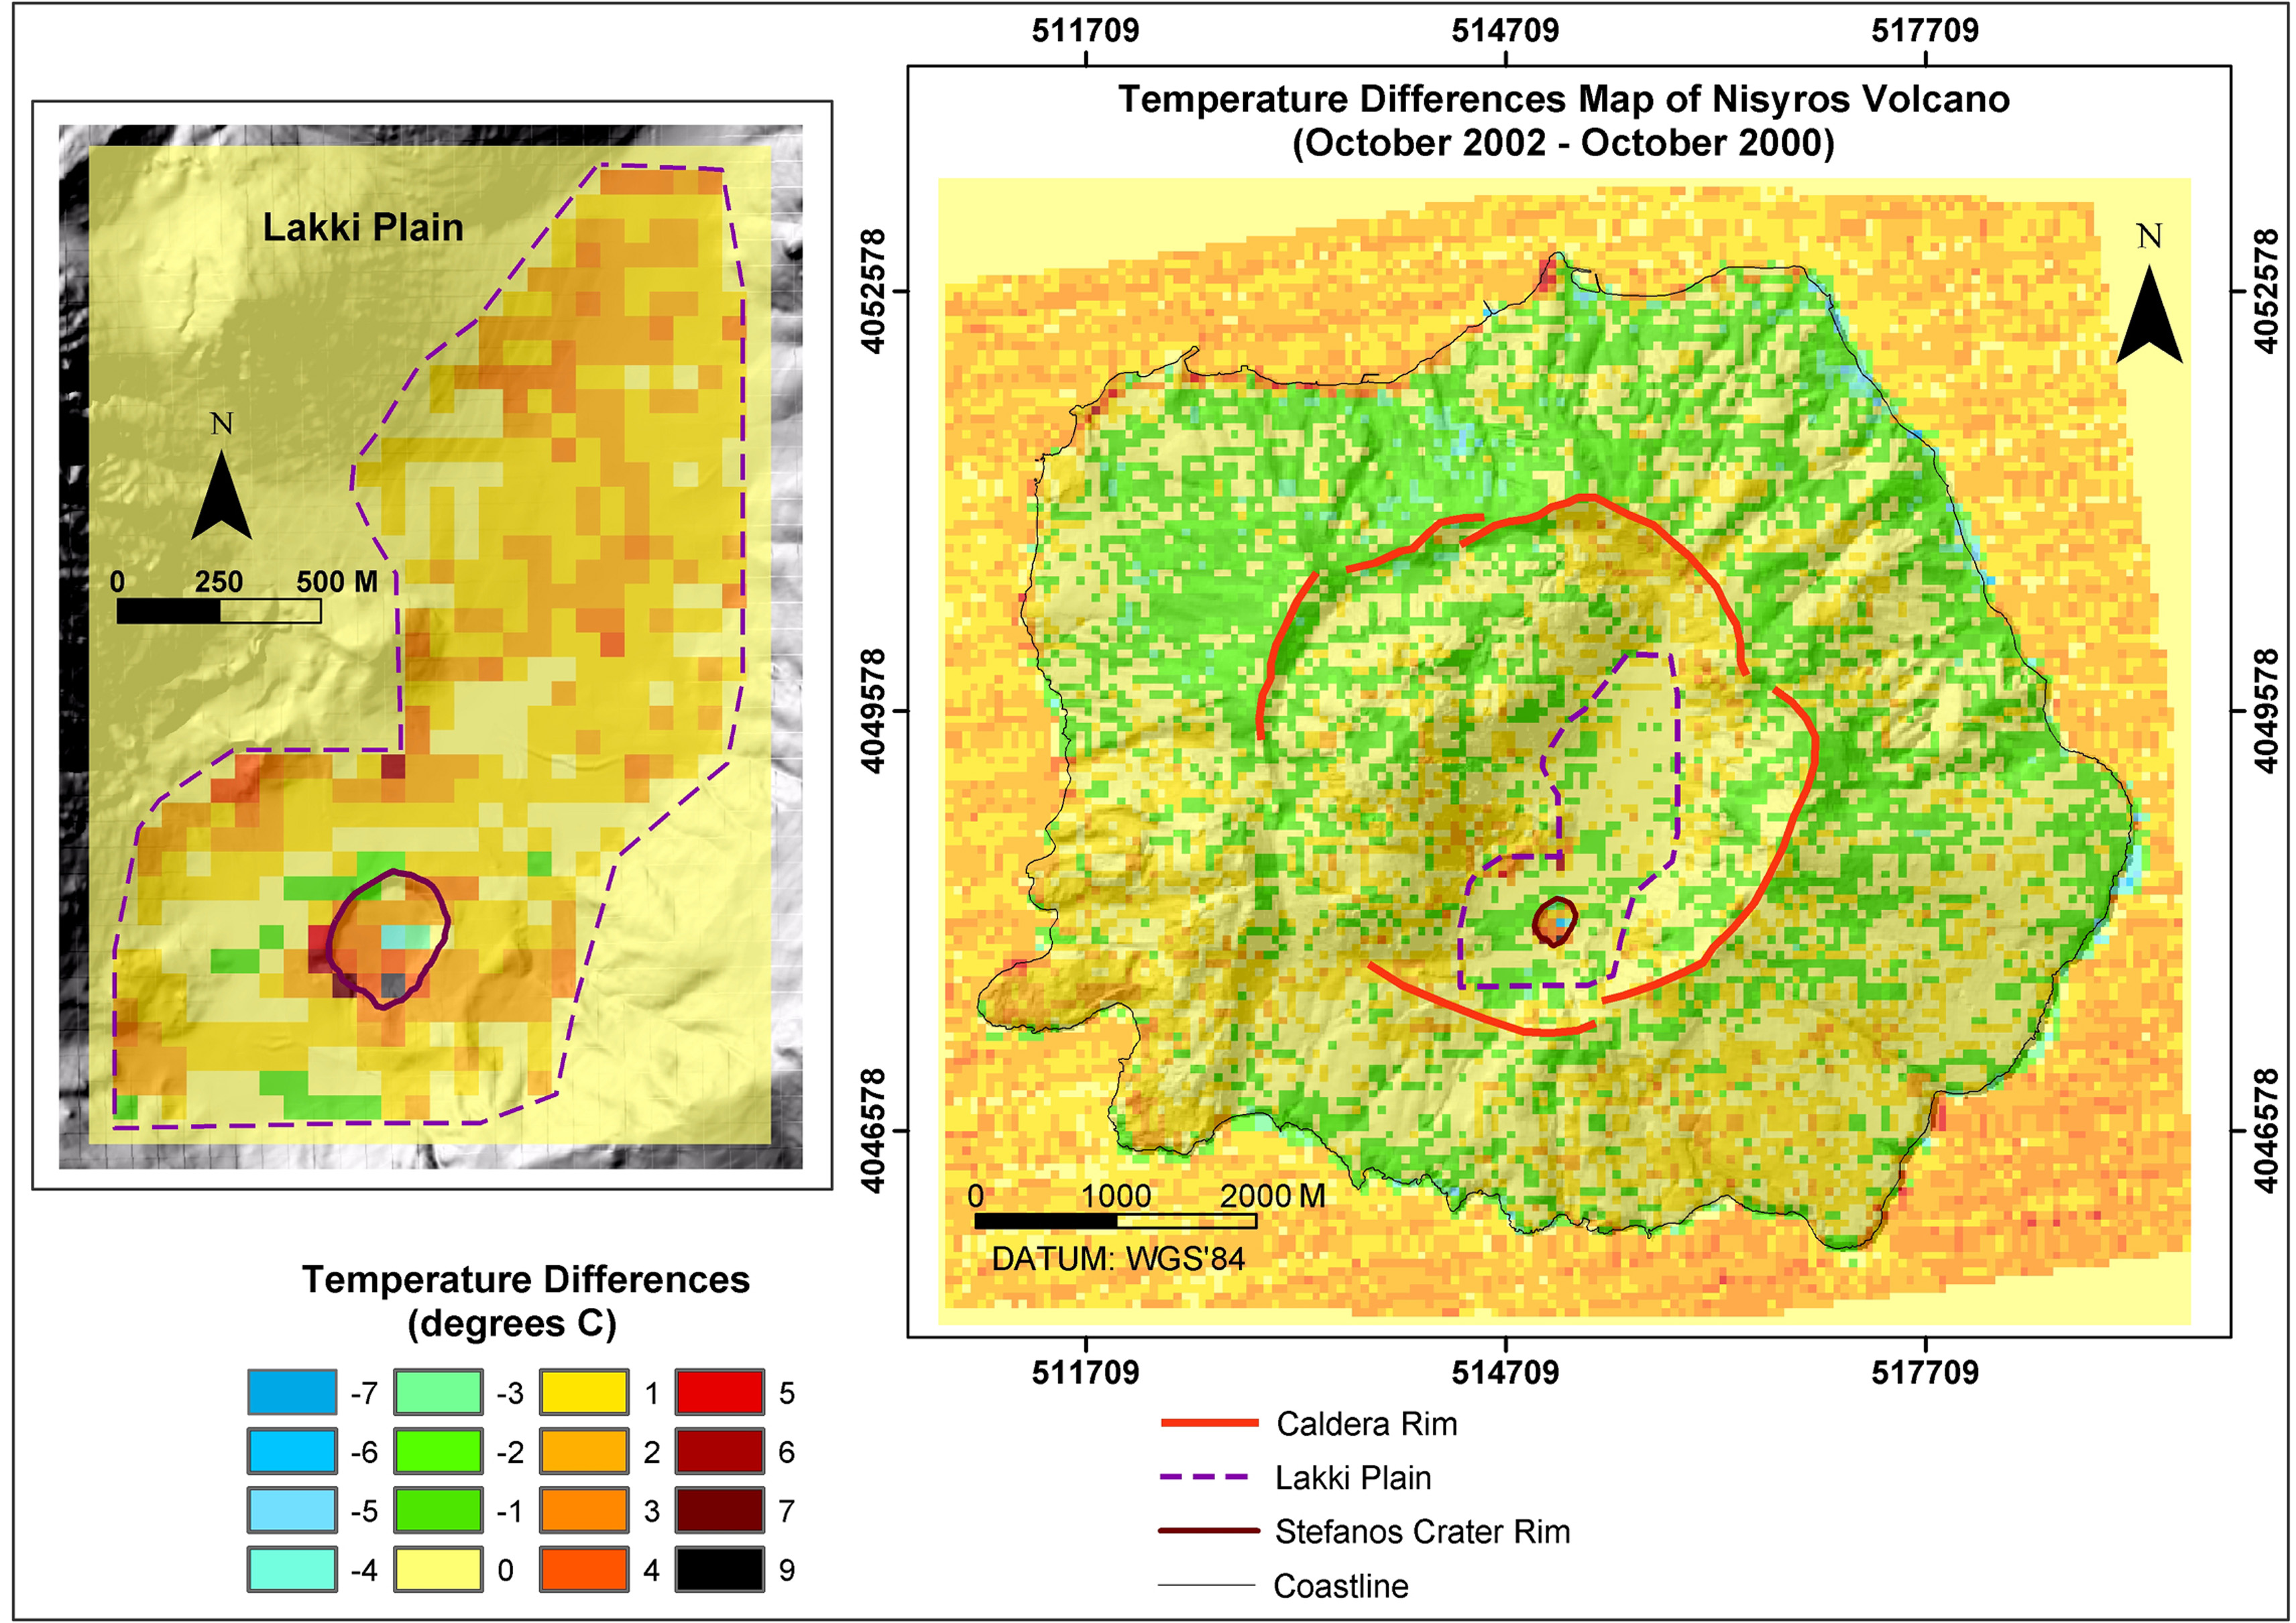 “Surface Temperature Difference Map” of LANDSAT-7 images (Oct. 26, 2002 and Oct. 20, 2000) of Nisyros Island. Enlarged section of Lakki Plain (left image) indicated as dashed line in the right image.
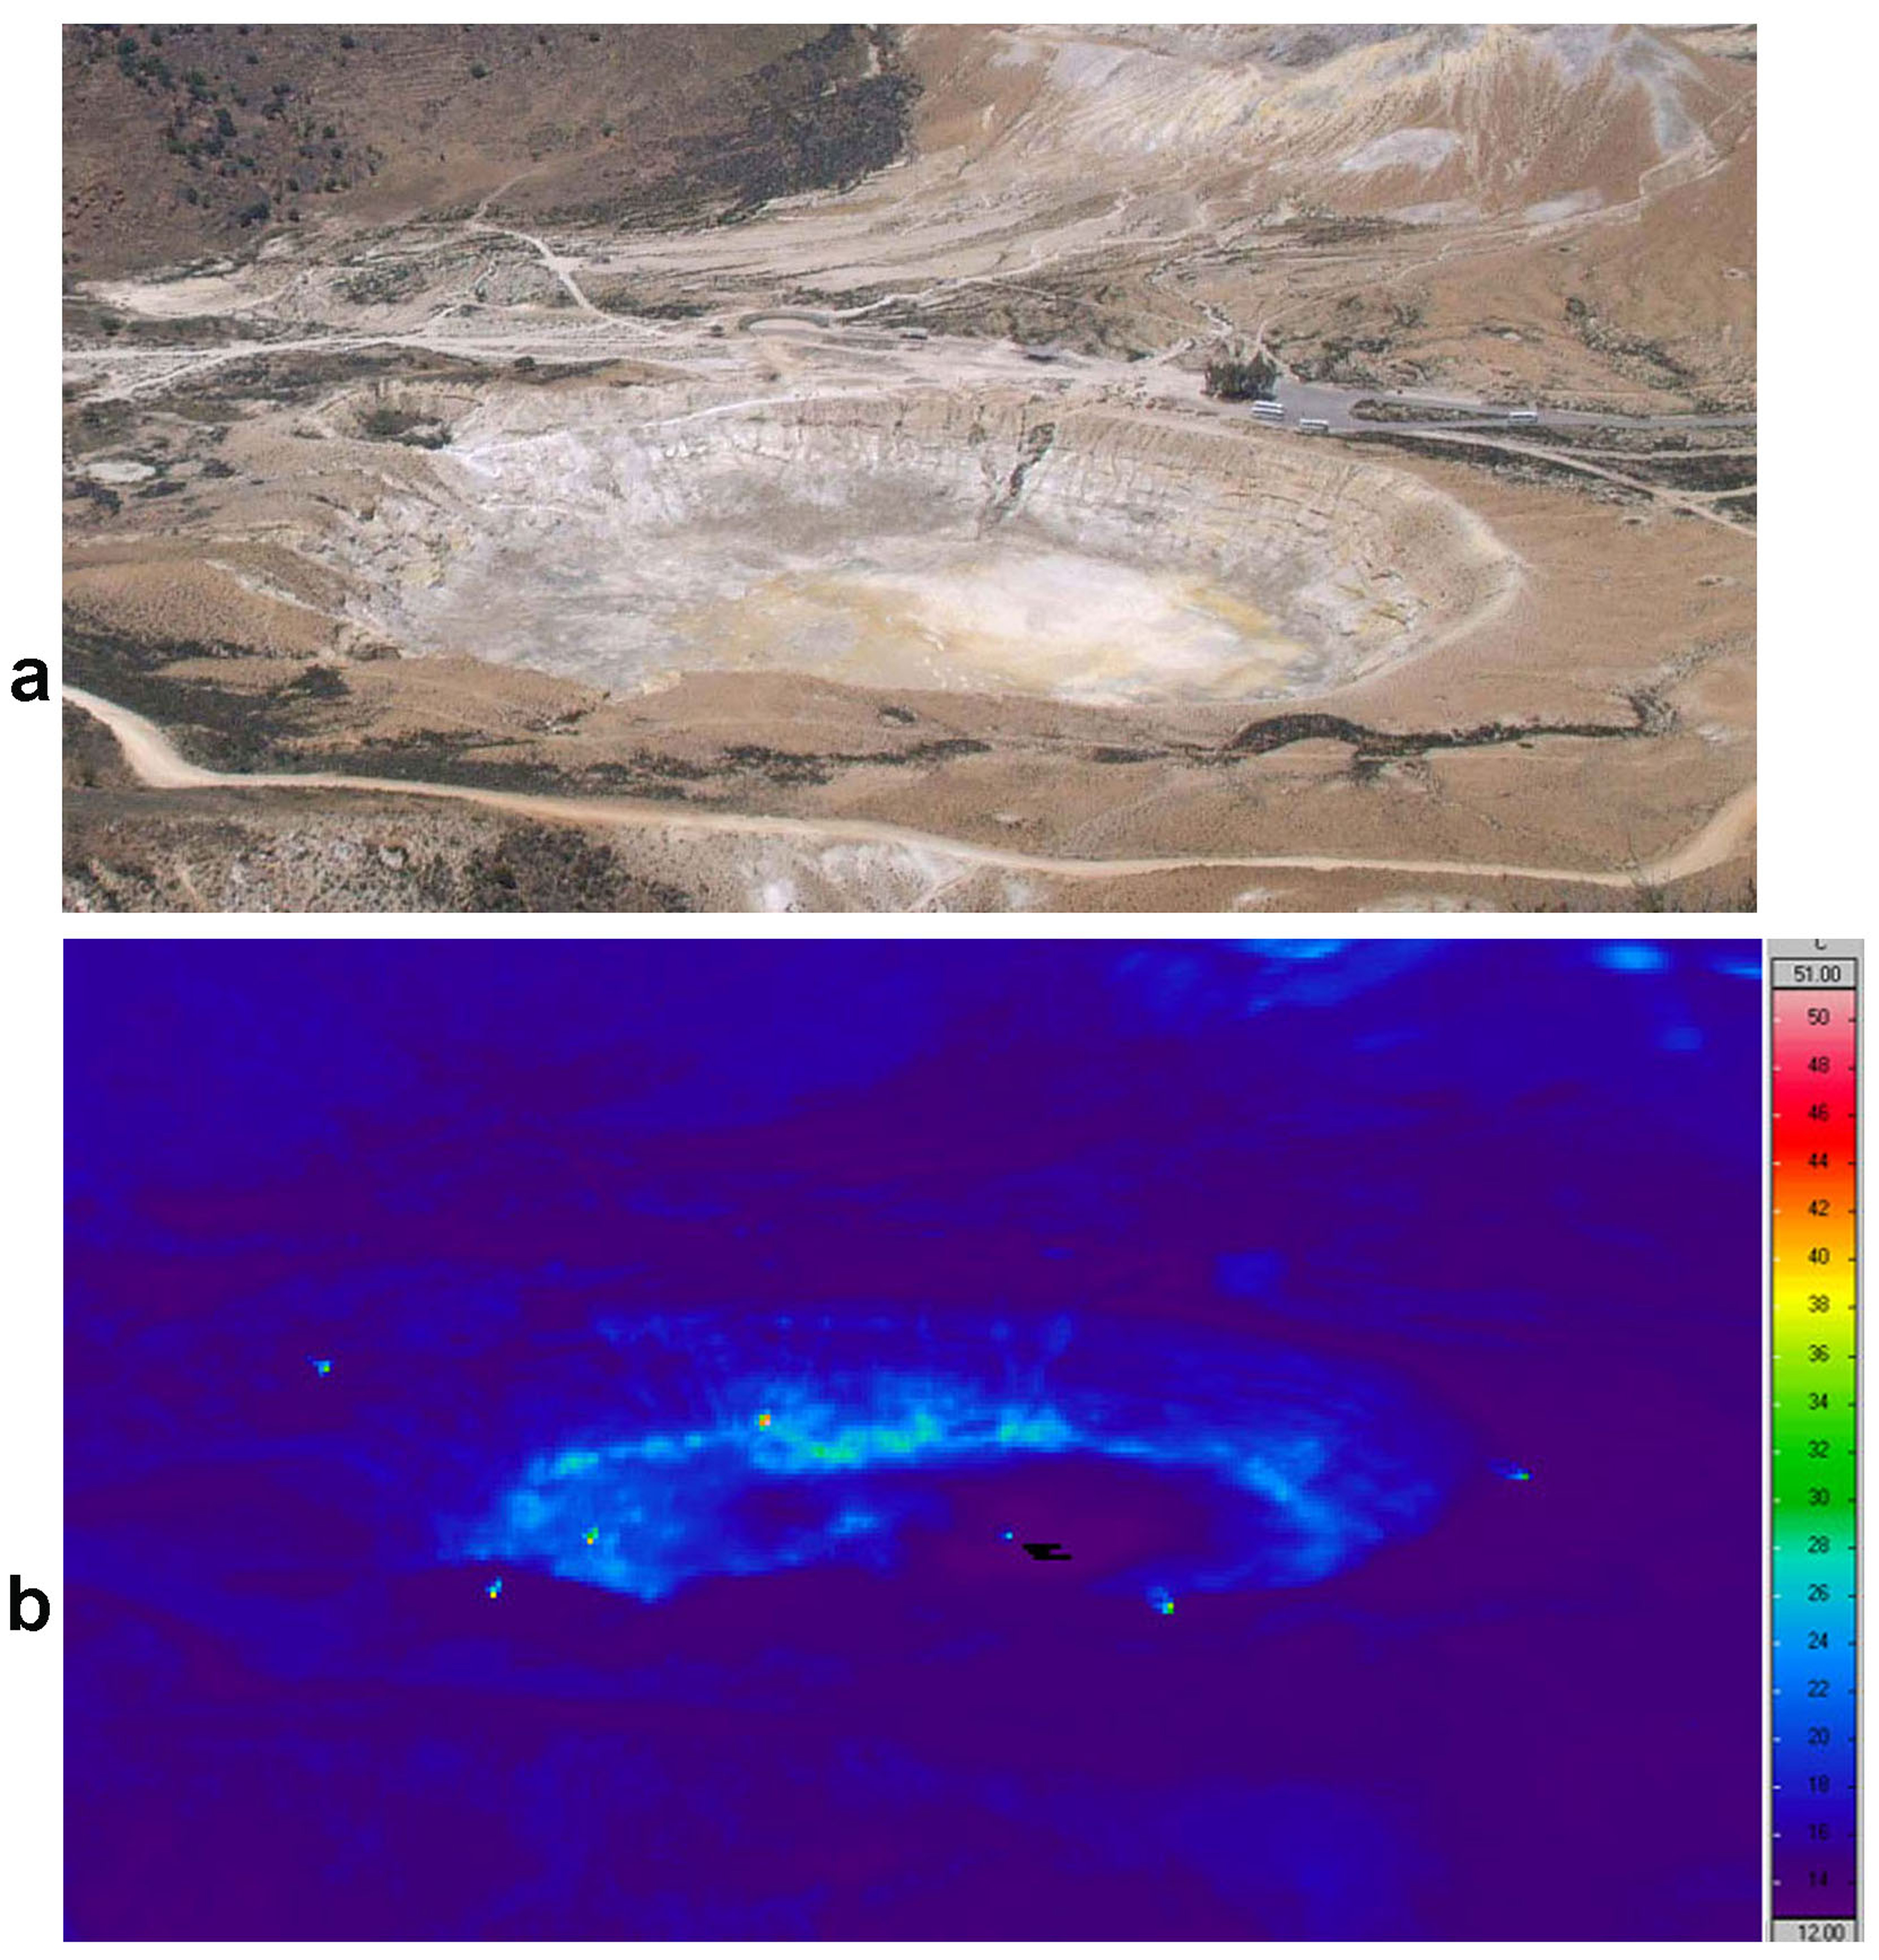
Ground Thermal IR Camera Images (Fig. 12 - 13)
| Figure | Figure |
|---|---|
 |
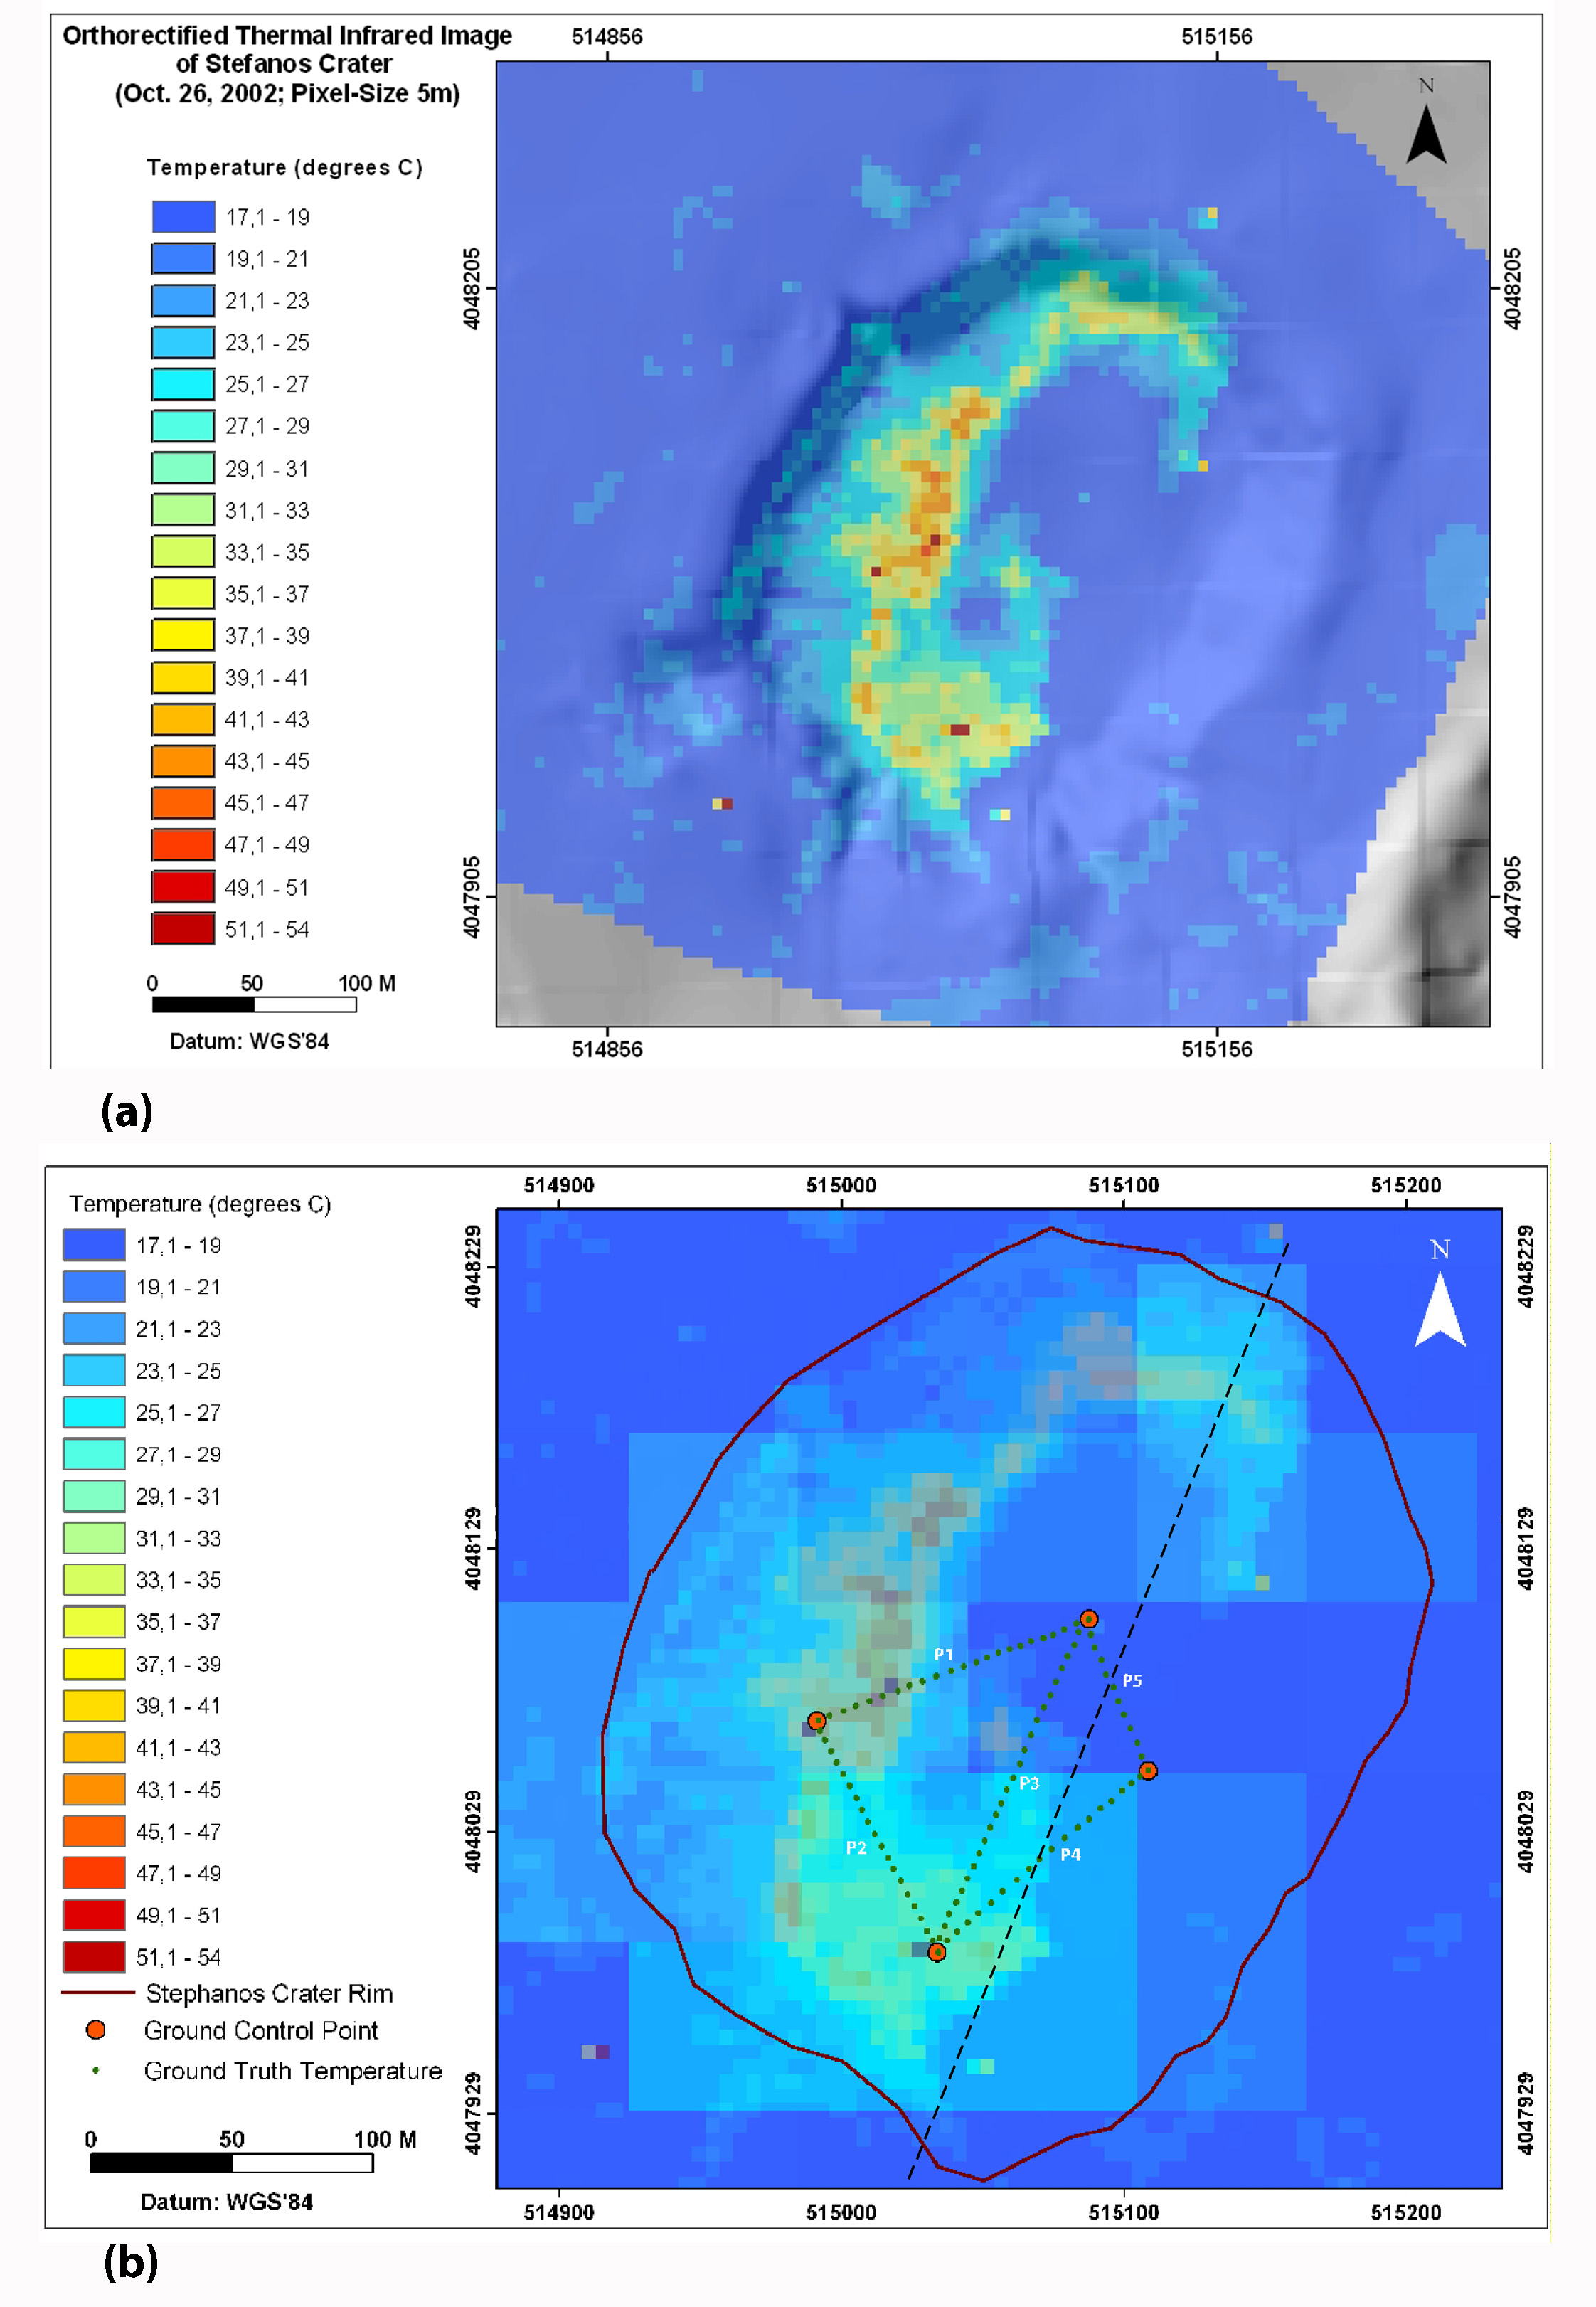 |
| Fig. 12. (a) Outline of Stephanos Crater with a depth of 20-25m viewed from Nikia (400m elevation, about 300m above the Lakki Plain | Fig. 13. (a) Ortho-rectified and thermally corrected thermal IR image (5mx5m pixel size) of figure 6b, showing cold and warm parts inside Stephanos Crater. Note that in the SE part of Stephanos Crater no temperature distribution is present, due to the low angular view and invisibility from Nikia (SE of dashed line). |
| (b) Ground Thermal IR (uncorrected) camera image of Stephanos Crater viewed from Nikia, showing the surface temperature variations. | (b) The ortho-IR thermal ground image of Stephanos Crater superimposed on the ortho-LANDSAT-7 image. Green points along P1, P2, P3, P4 & P5 sections indicate the ground temperature measurements (5 m increment). |
Temperature Variation Profiles (Fig. 14)
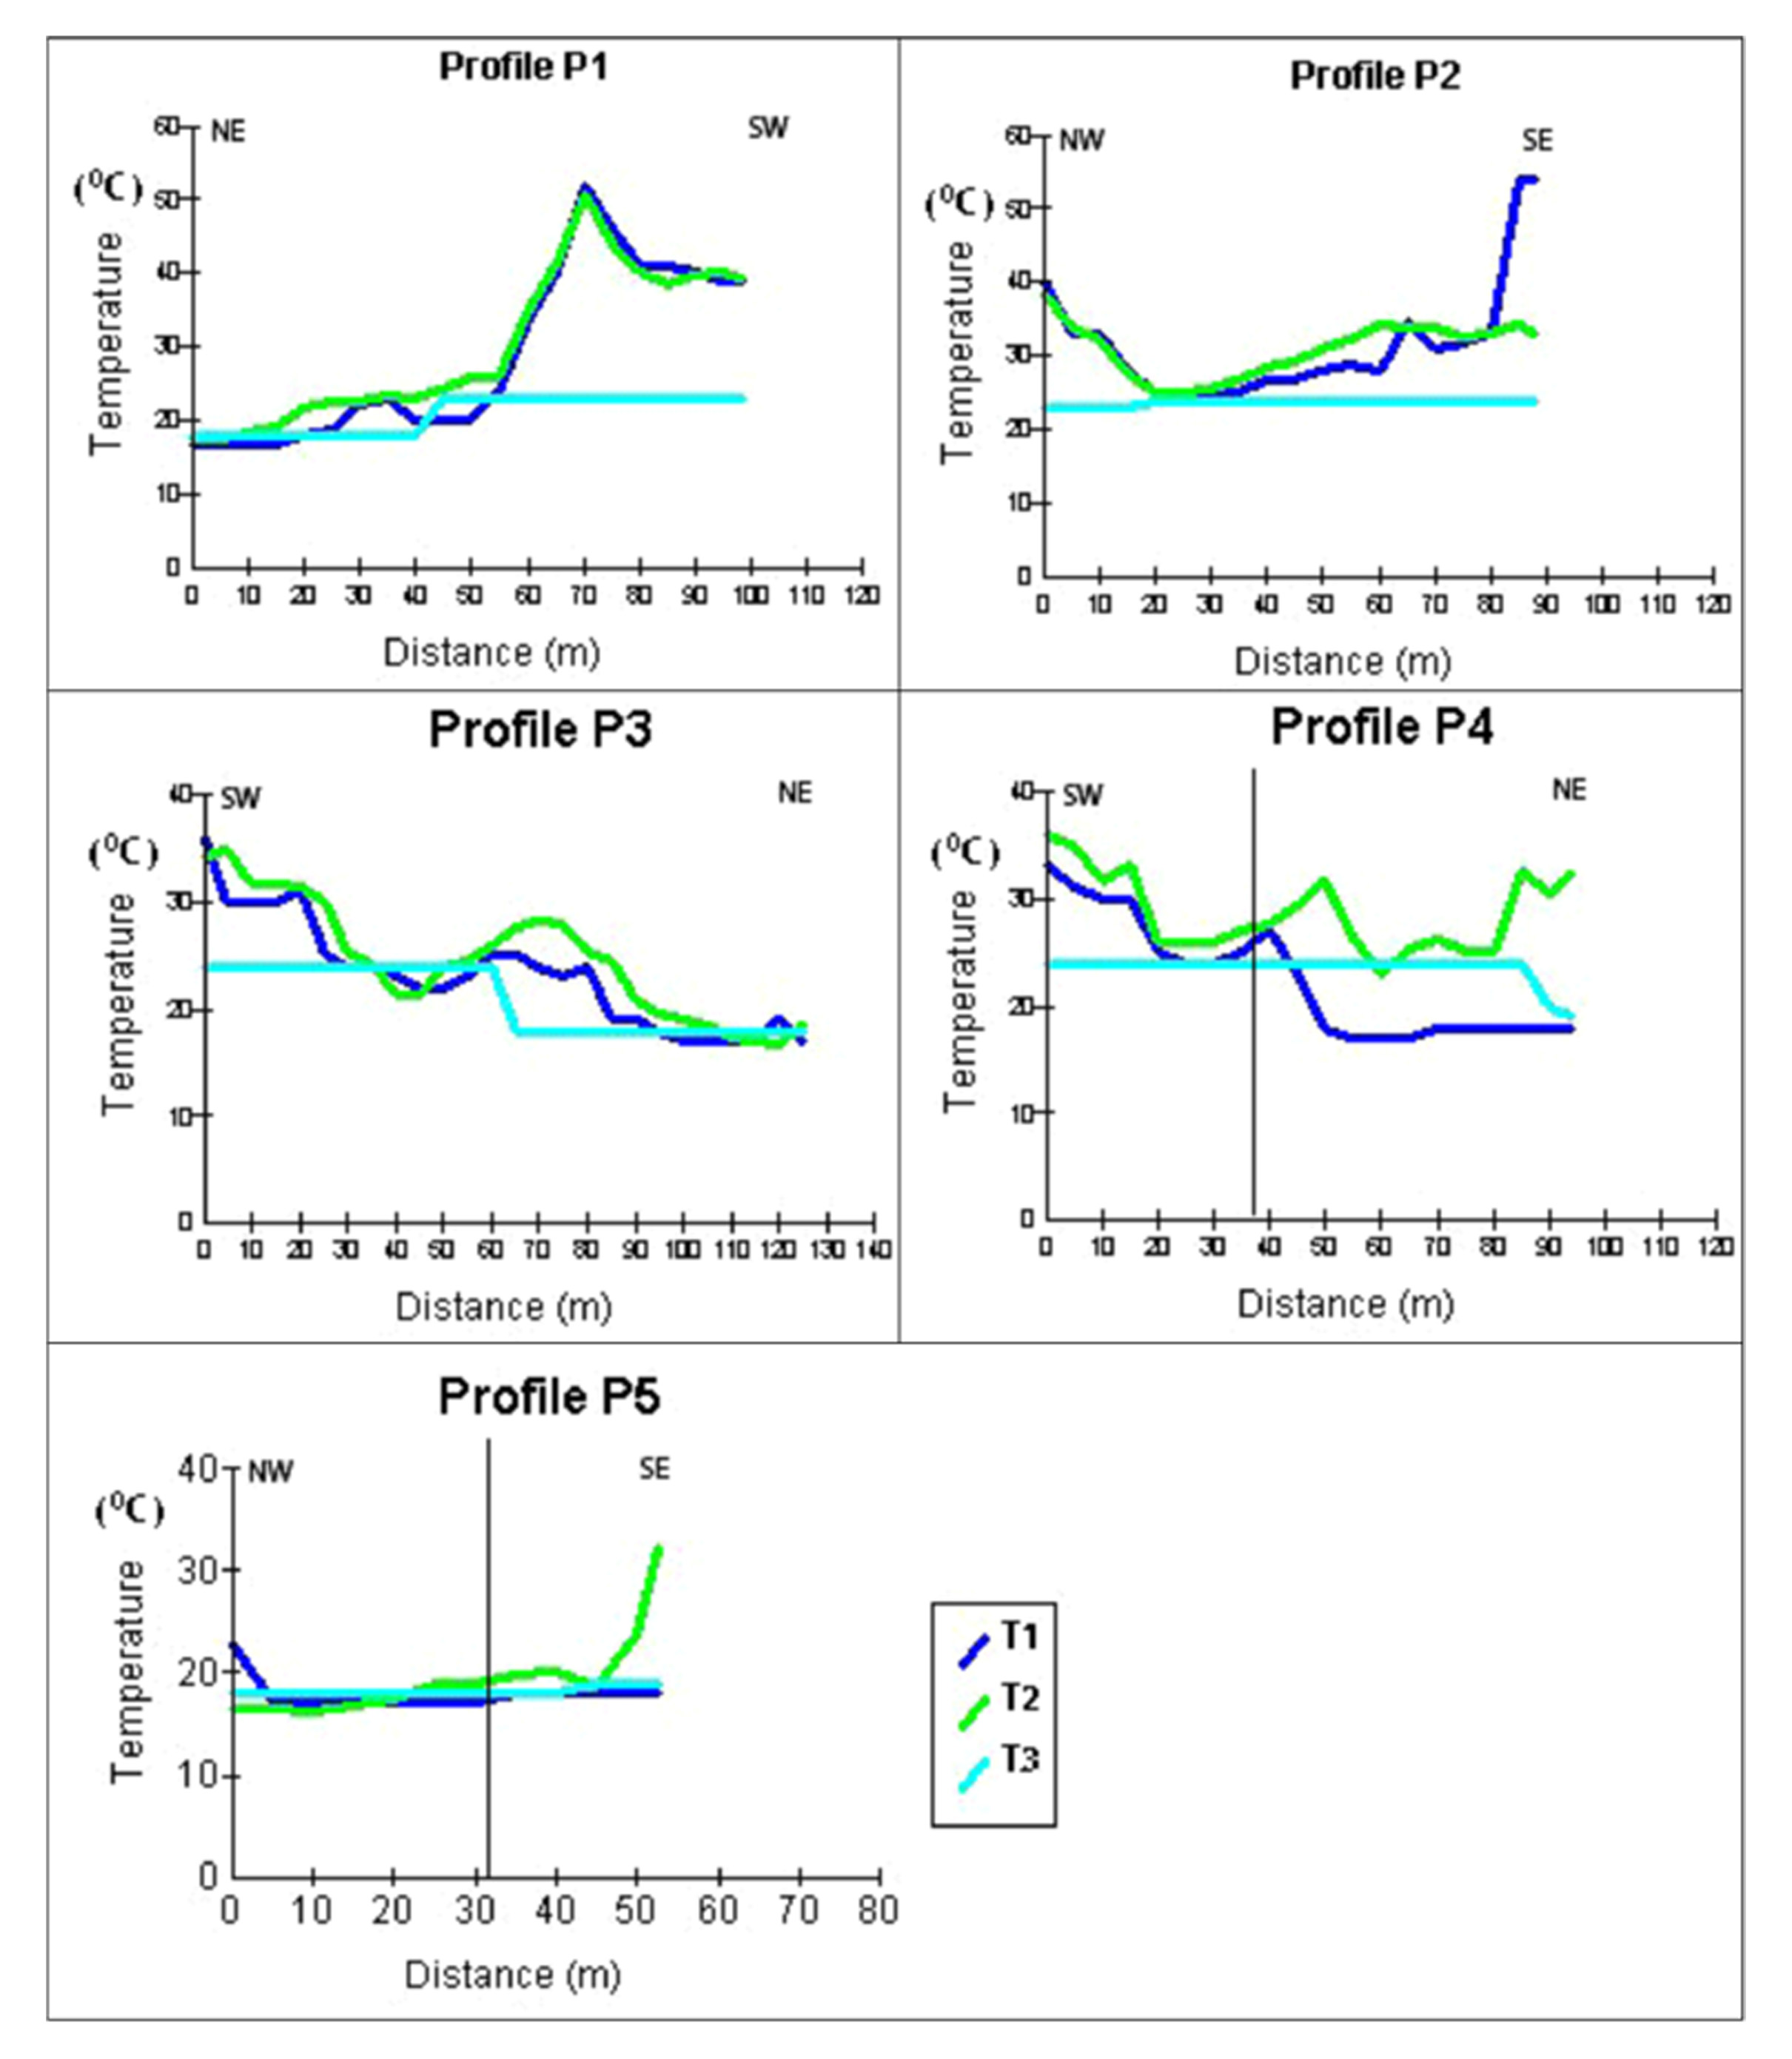 Temperature variation of ground IR thermal image (T1), ground truth temperature measurements (T2) and LANDSAT-7 image (T3) along the five profiles inside Stephanos Crater.
Ground Deformation Analysis
Combined DGPS measurements and Differential Interferometry (DInSAR) were applied on Nisyros Volcano to study the ground deformation of the area. The GPS network was established to monitor the crustal deformation in June 1997, after an intense local seismic activity, which broke out in 1996. Measurements were undertaken in September and December 1997, twice in 1998, and annually since 1999 onwards. A station at the NE part of Kos was chosen as reference station (with fixed coordinates) of the network. Geodetic receivers of WILD type (SR 299 and SR399) were used for the field GPS campaigns.
The Nisyros GPS network consists of 16 stations covering whole of the island. Since the dimensions of the network are relatively small, being controlled by the relatively small dimensions of Nisyros (about 8 km diameter), it is evident that the length of the measured baselines between the GPS stations in Nisyros is considerably small (3-4 km). The larger length baseline is 32 km, from the Kos reference station to Nisyros.
A general uplift was measured at all stations of the network ranging from 14 to 140 mm, which after 1998 showed a decline, maintaining though the uplifted character of the deformation. The amplitude of the horizontal deformation was ranging from 13mm to 40mm for the period of only three months (June-Sept. 1997), which increased up to 53mm for the next eight months. The directions of the horizontal deformation observed at the GPS stations (1997-2001) indicate that the island is generally expanding mainly to the East, West and South. Detailed modelling attempts of the observed DGPS displacements from 1997-2001 were made.
Ground Deformation Maps
Fig. 15. Observed horizontal (left part) and height (right part) displacements on Nisyros deduced from DGPS measurements for the period 1997-2001
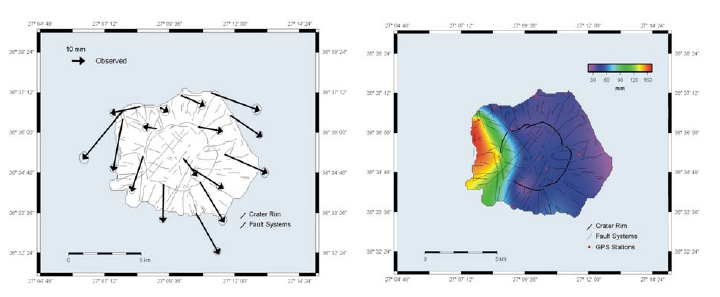 Observed horizontal (left part) and height (right part) displacements on Nisyros deduced from DGPS measurements for the period 1997-2001.
References
Vassilopoulou, S., Hurni, L., Dietrich, V., Baltsavias, M., Pateraki, M., Lagios, E., Parcharidis, Is. (2002): Ortho-Photo Generation using IKONOS-2 Imagery and High Resolution DEM: A Case Study on Volcanic Hazard Monitoring of Nisyros Island (Greece), ISPRS Journal of Photogrammetry and Remote Sensing, 57 (1-2), 24-38.
Vassilopoulou, S., Hurni, L. (2001): The Use of Digital Elevation Models in Emergency and Socio-Economic Planning: A Case Study at Kos – Yali – Nisyros - Tilos Islands, Greece. Proc. 20th International Cartographic Conference, Beijing, China. Chinese Society of Geodesy, Photogrammetry and Cartography, 3424-3431 (on CDROM).
Lagios, E., Vassilopoulou, S., Sakkas, V., Dietrich, V., Damiata, B.N., & Ganas, A. (2007): Testing Satellite and Ground Thermal Imaging of Low-Temperature Fumarolic Fields: The Dormant Nisyros Volcano (Greece). ISPRS Journal of Photogrammetry and Remote Sensing, 62, 447–460.
Sakkas V., Lagios E., Parcharidis Is., Vassilopoulou Sp. (2003): Surface Displacement Model of Nisyros Volcanic Field deduced from DinSAR Analysis & DGPS Measurements. Bulletin of the Geological Society of Greece, v. 35, 118-128.
Area 3 : LARISSA PLAIN
Larissa is located at the Eastern Thessaly Plain. Thessaly’s total area is about 14.036 km2. The Pinios River and its tributaries drain the entire hydrologic basin of Thessaly. It is surrounded by mountainous areas which form its watershed. The land subsidence which occurs at the Larissa Basin (Thessaly Plain, Central Greece) is due to various causes including aquifer system compaction. Deformation maps of high spatial resolution deduced by the Persistent Scattering Interferometry (PSI) technique (using radar scenes from ERS and ENVISAT satellites) for the period 1992-2006 were produced to study the spatial and temporal ground deformation.
A developed GIS database (including geological, tectonic, morphological, hydrological, meteorological and watertable variation from wells in the area) offered the possibility of studying in detail the intense subsidence. The PSI based average deformation image clearly shows that subsidence generally takes place inside the Larissa Plain ranging from 5-250 mm. The largest amplitude rates (-25 mm/yr) are observed around the urban area of Larissa City (especially at Gianouli and Nikea villages), while the Larissa City center appears to be relatively stable with a tendency to subside. The rest of the plain regions seem to subside at moderate rates (about 5-10 mm/yr). The surrounding mountainous area is stable, or has slightly been uplifted with respect to the NE located reference point. It was found that there is a correlation between the seasonal water-table variation (deduced from wells data), the seasonal water demand for irrigation associated with specific types of cultivation (cotton fields), the monthly rainfall, and the observed subsidence rate in the rural regions of the Thessaly Plain.
Terrain Analysis
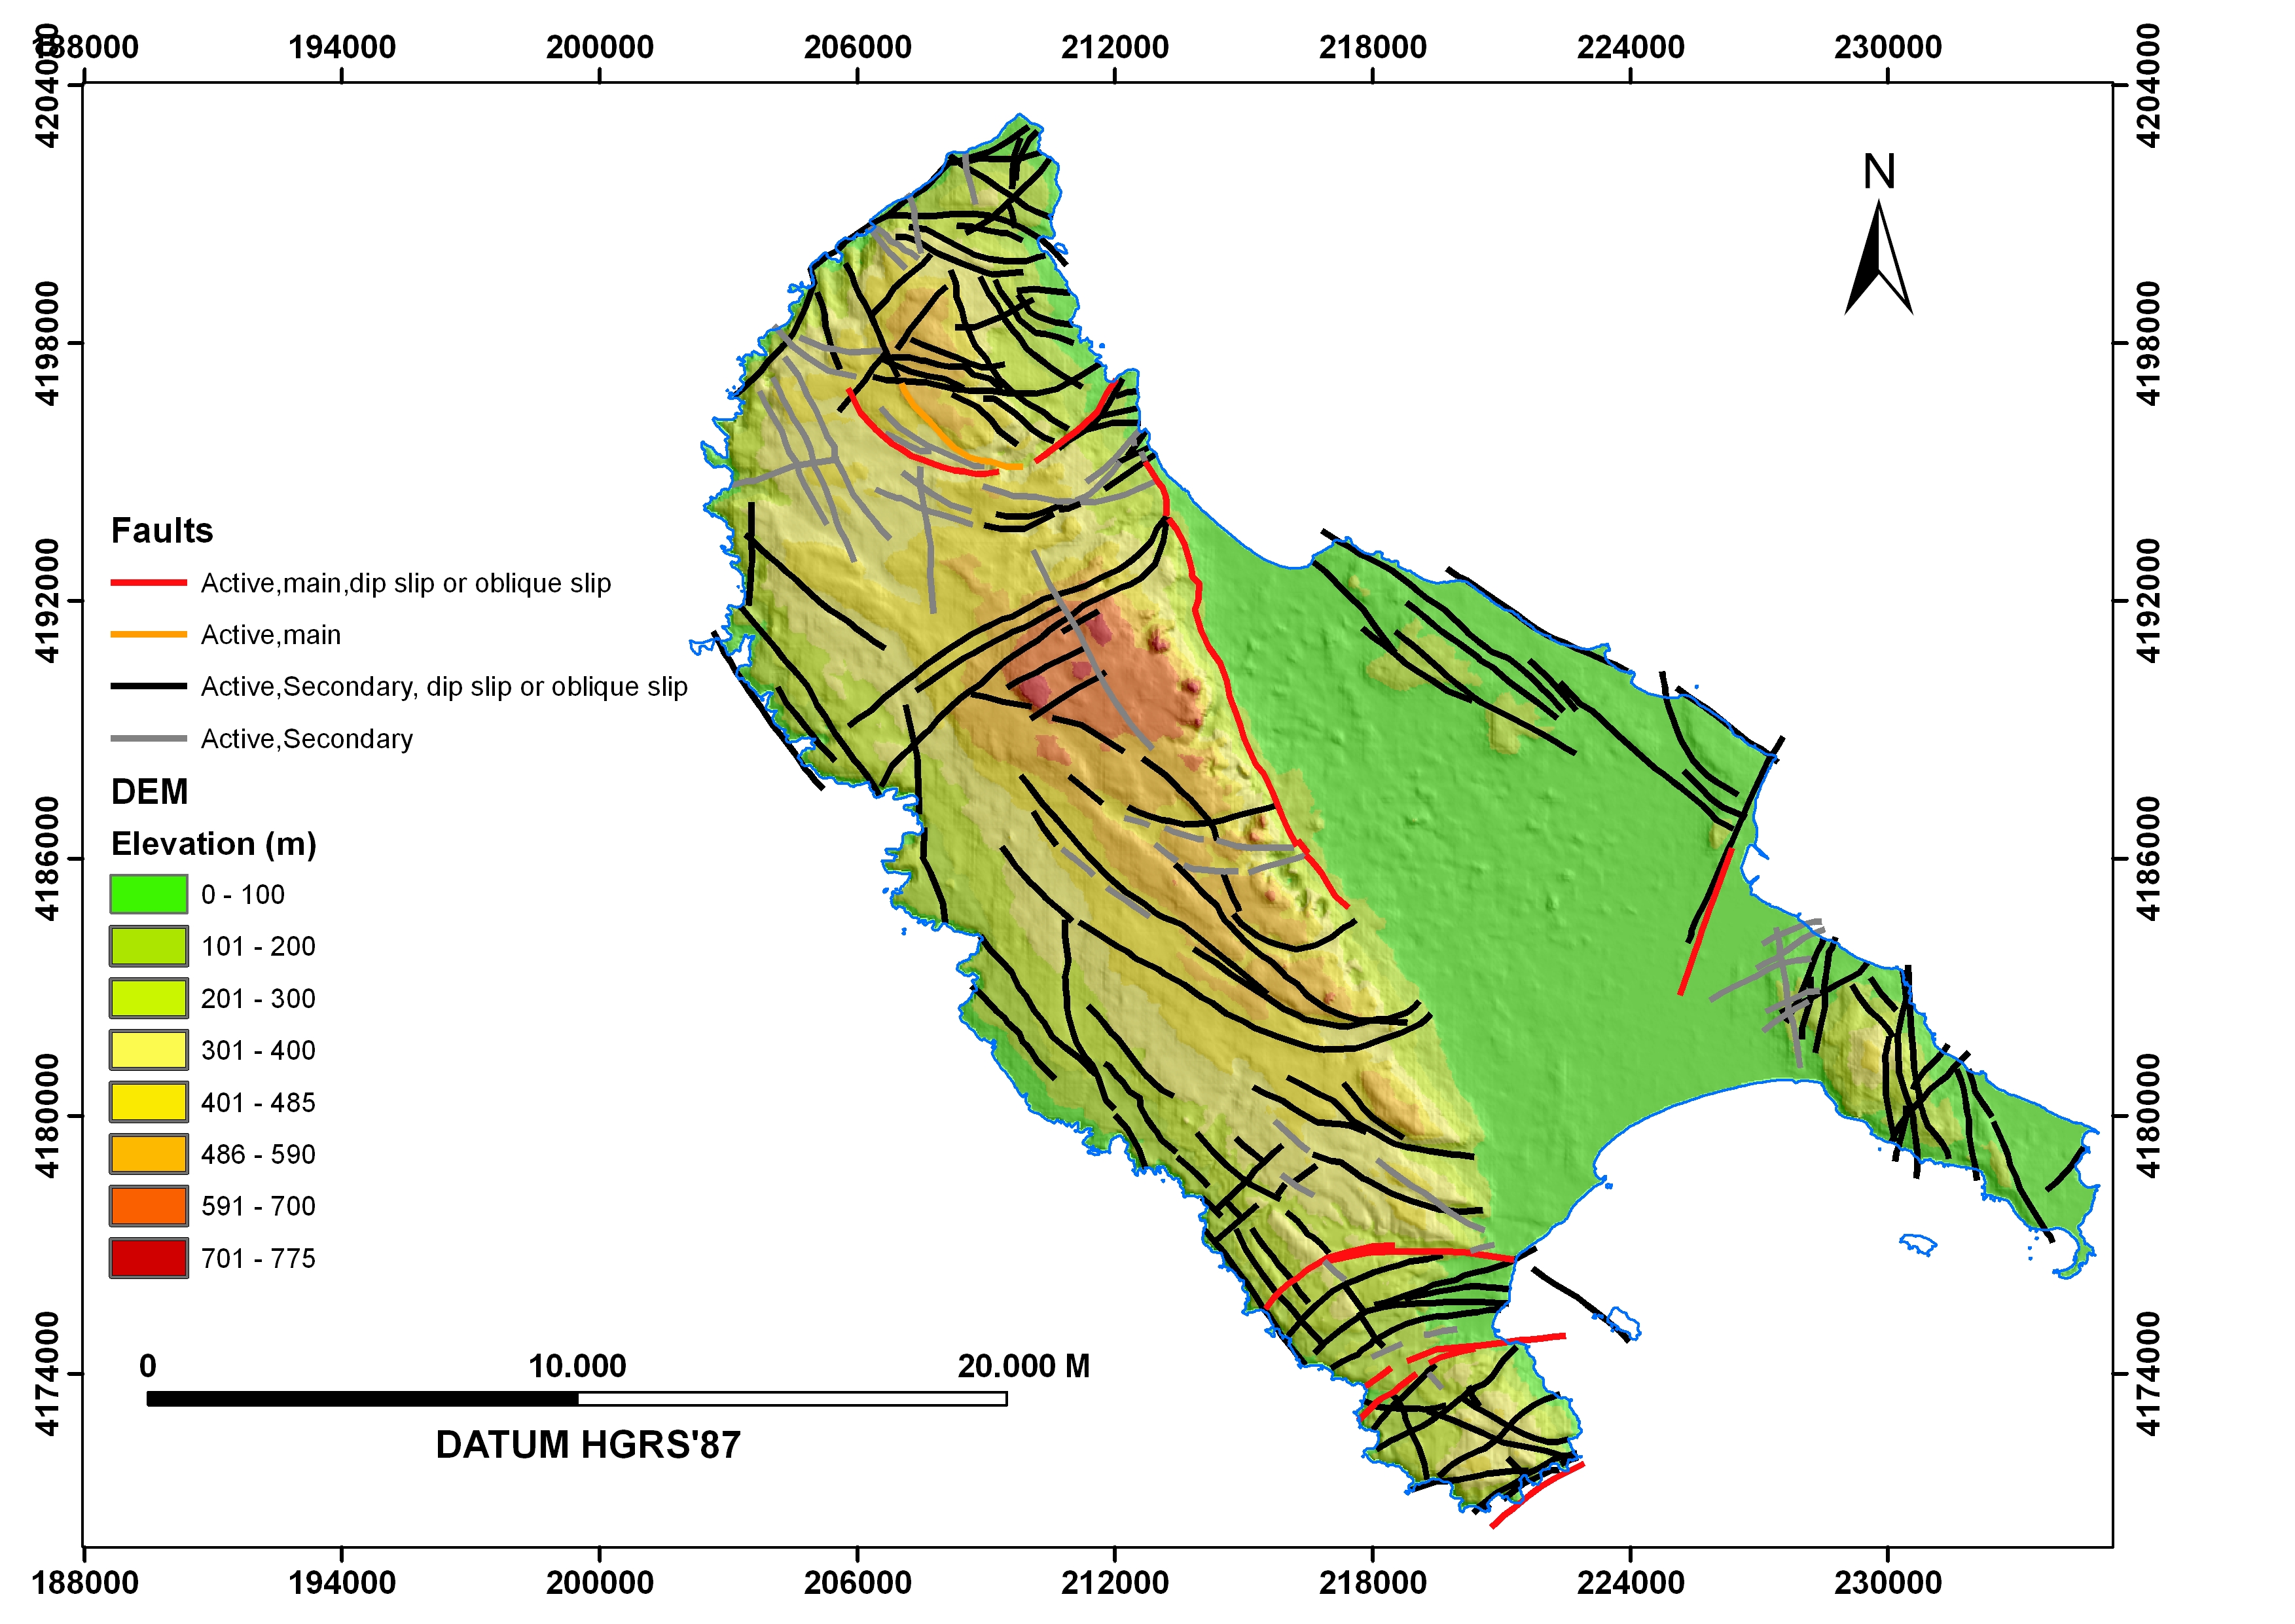
Digital Elevation Model (Fig. 16)
 The shaded relief of the study area based on the 25 meters resolution ASTER GDEM (a product of METI and NASA) with the faulting zones according to Caputo (1990) & Caputo et al (1993). The terrain is rough and depends on tectonics, mainly.
Terrain Analysis Map of Larissa Plain (Fig. 17)
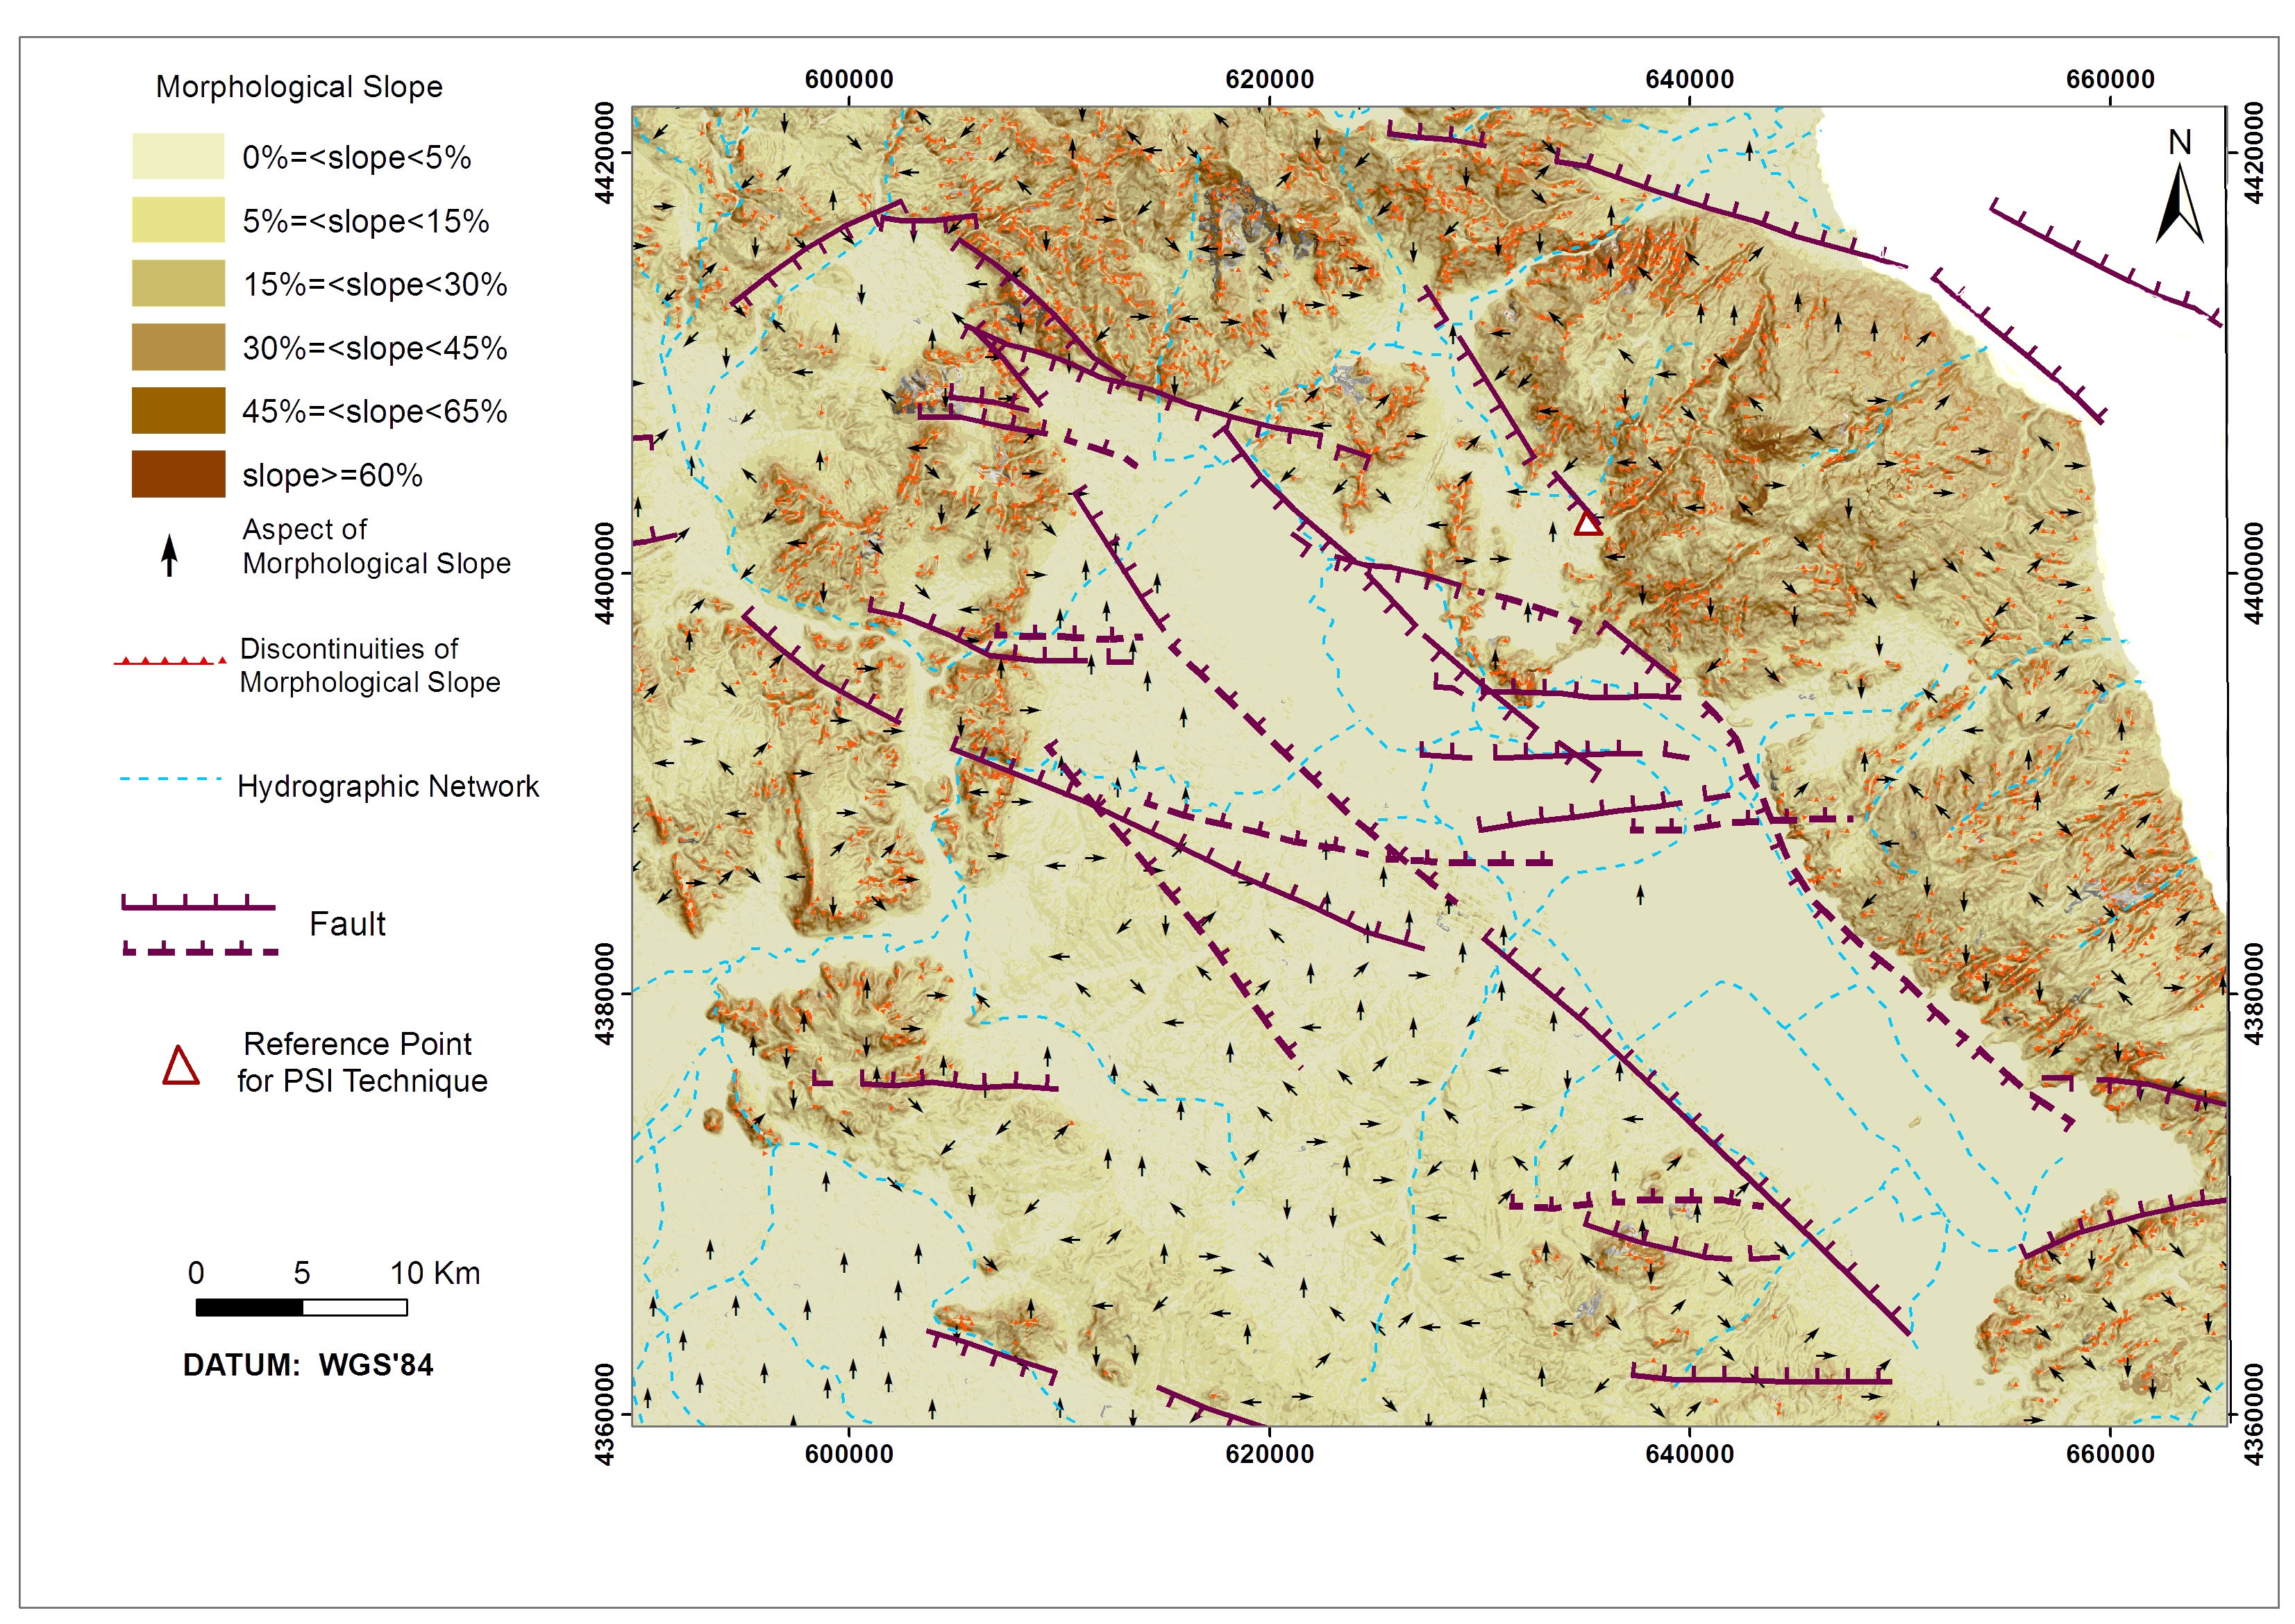 Intense morphological slopes with morphological discontinuities around Larissa Plain can be distinguished after the terrain analysis using the software PROANA. These data will be used for the statistical analysis in relation to the tectonic data.
Statistical Analysis – Rose Diagrams (Fig. 18)
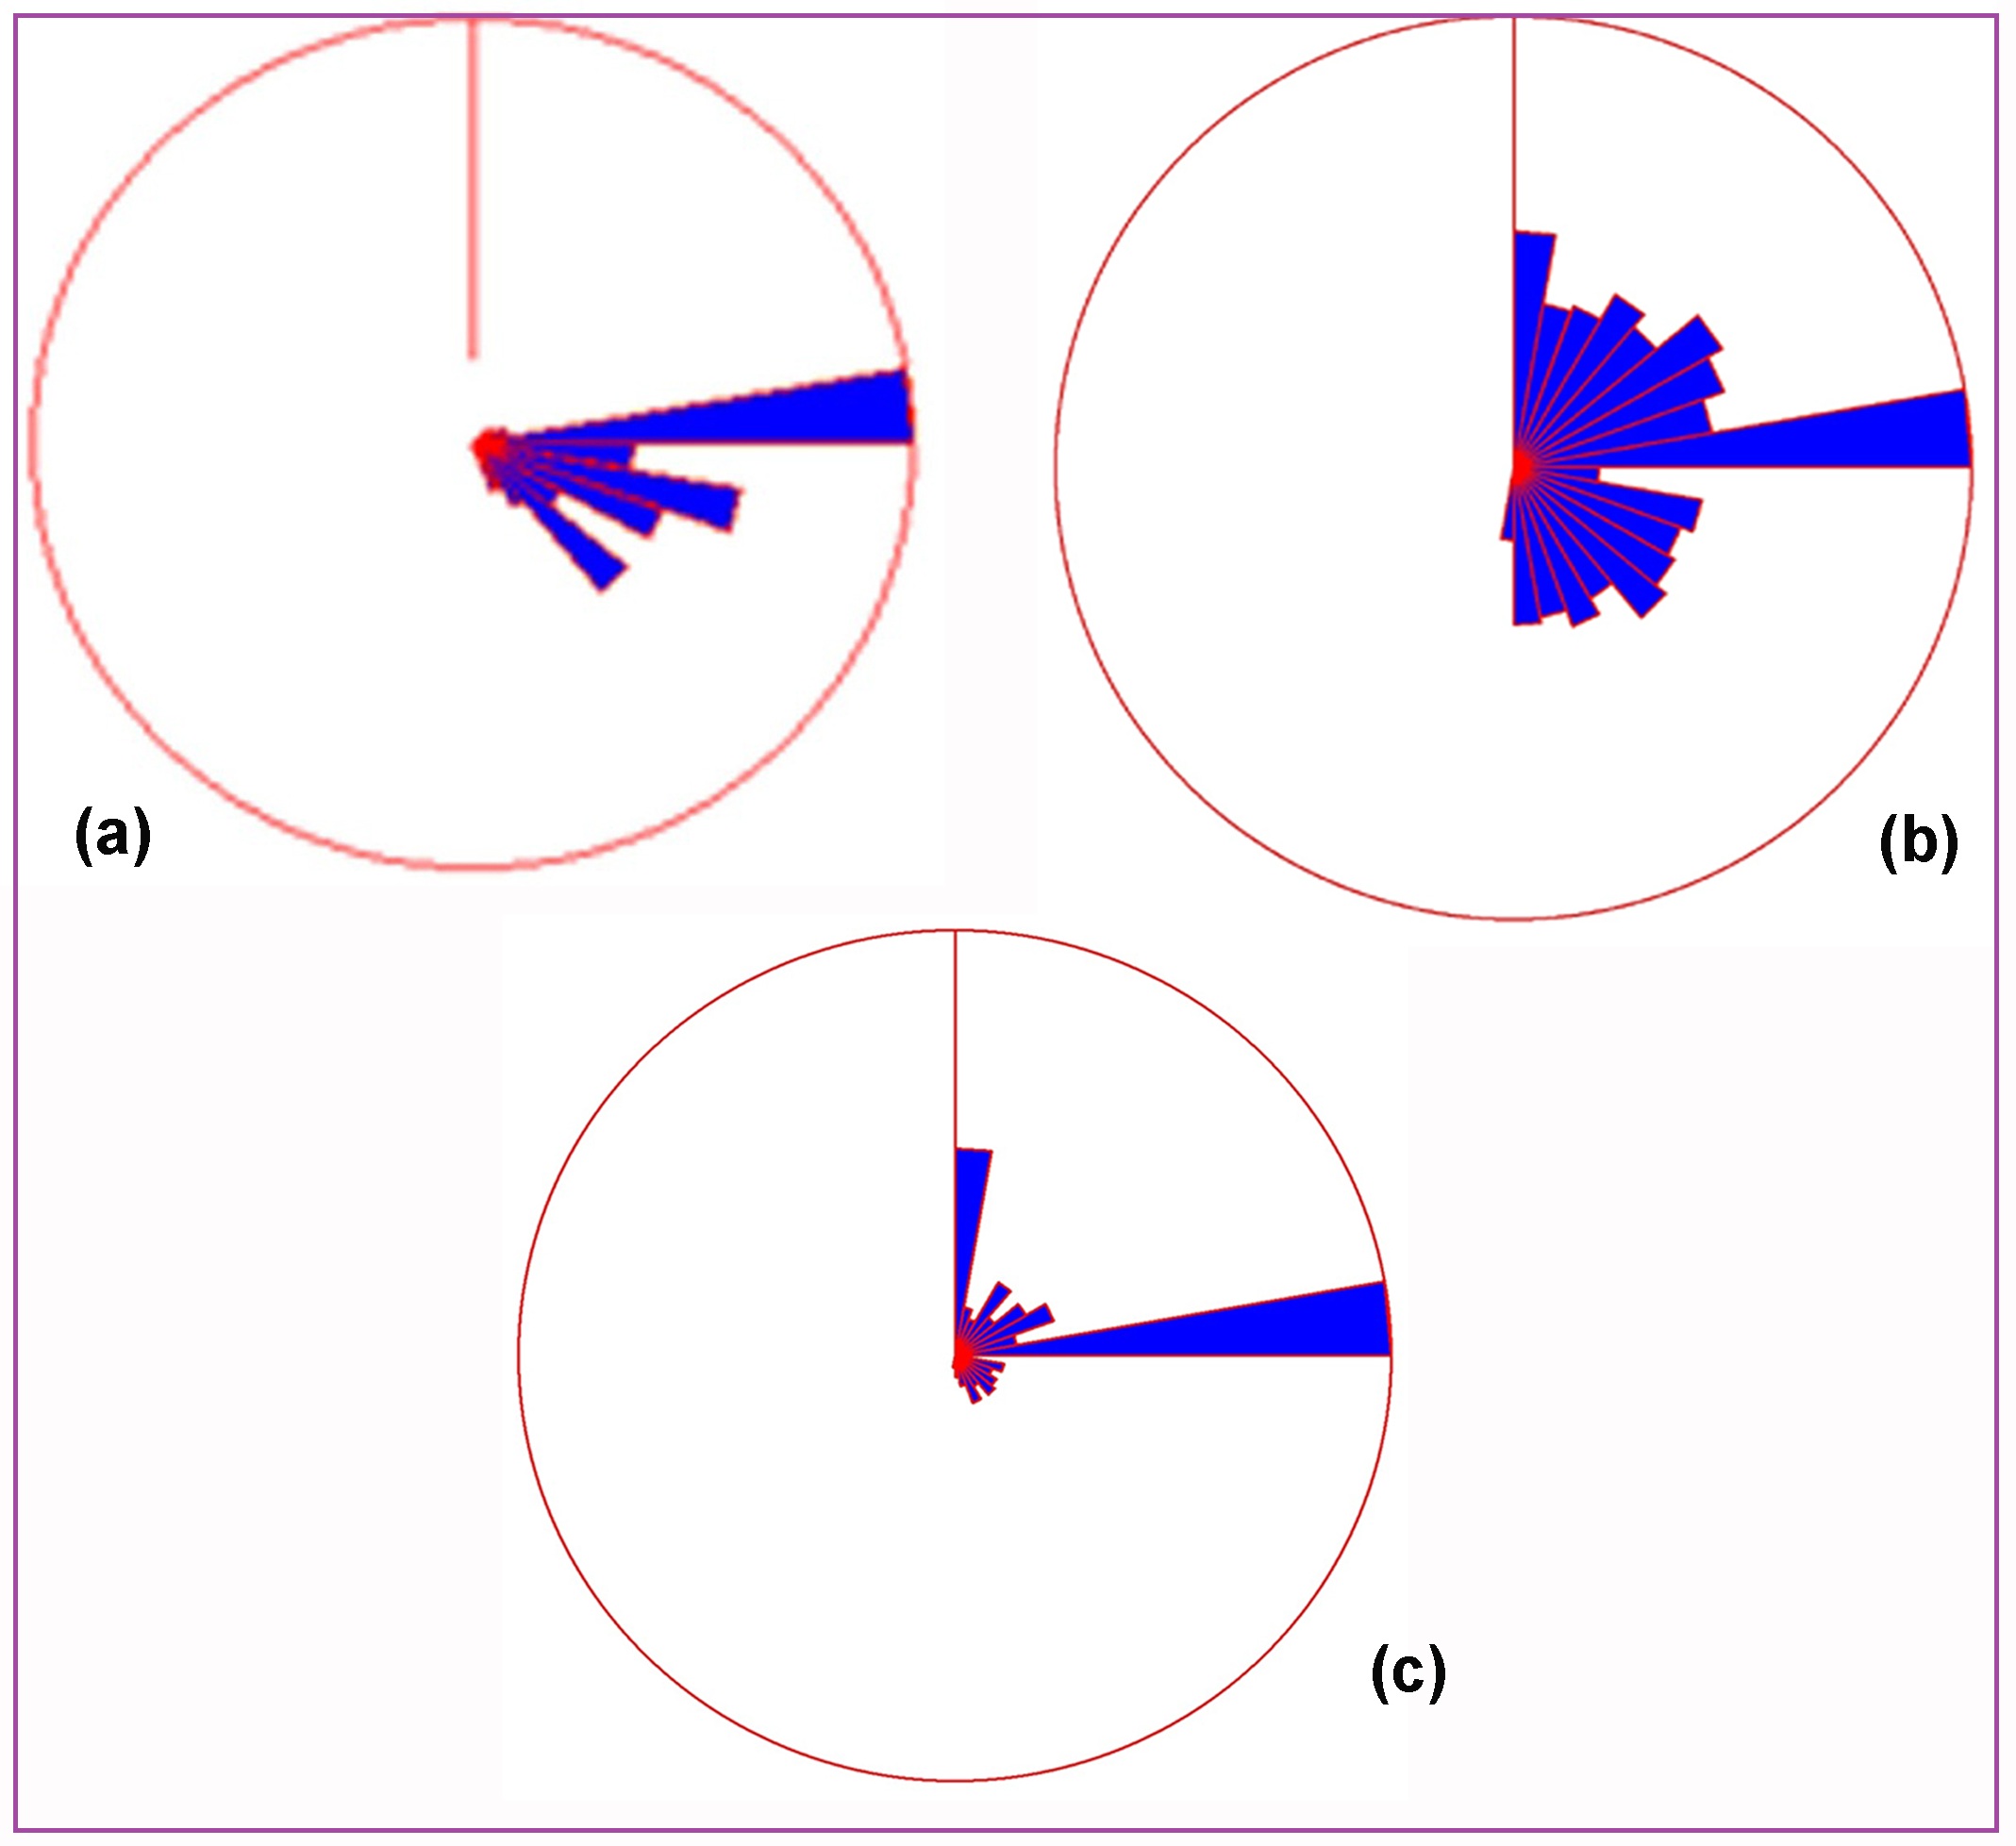
a) A main E-W direction as well as the ESE-WNW and SE-NW directions of the faulting zones can be observed in the rose-diagram. b) The main terrain direction is the E-W but other directions can also be observed. c) The main direction of the discontinuities of morphological slopes is the E-W. The N-S and other directions can be observed too.
Ground Deformation Analysis
Ground Deformation Map (Fig. 19)
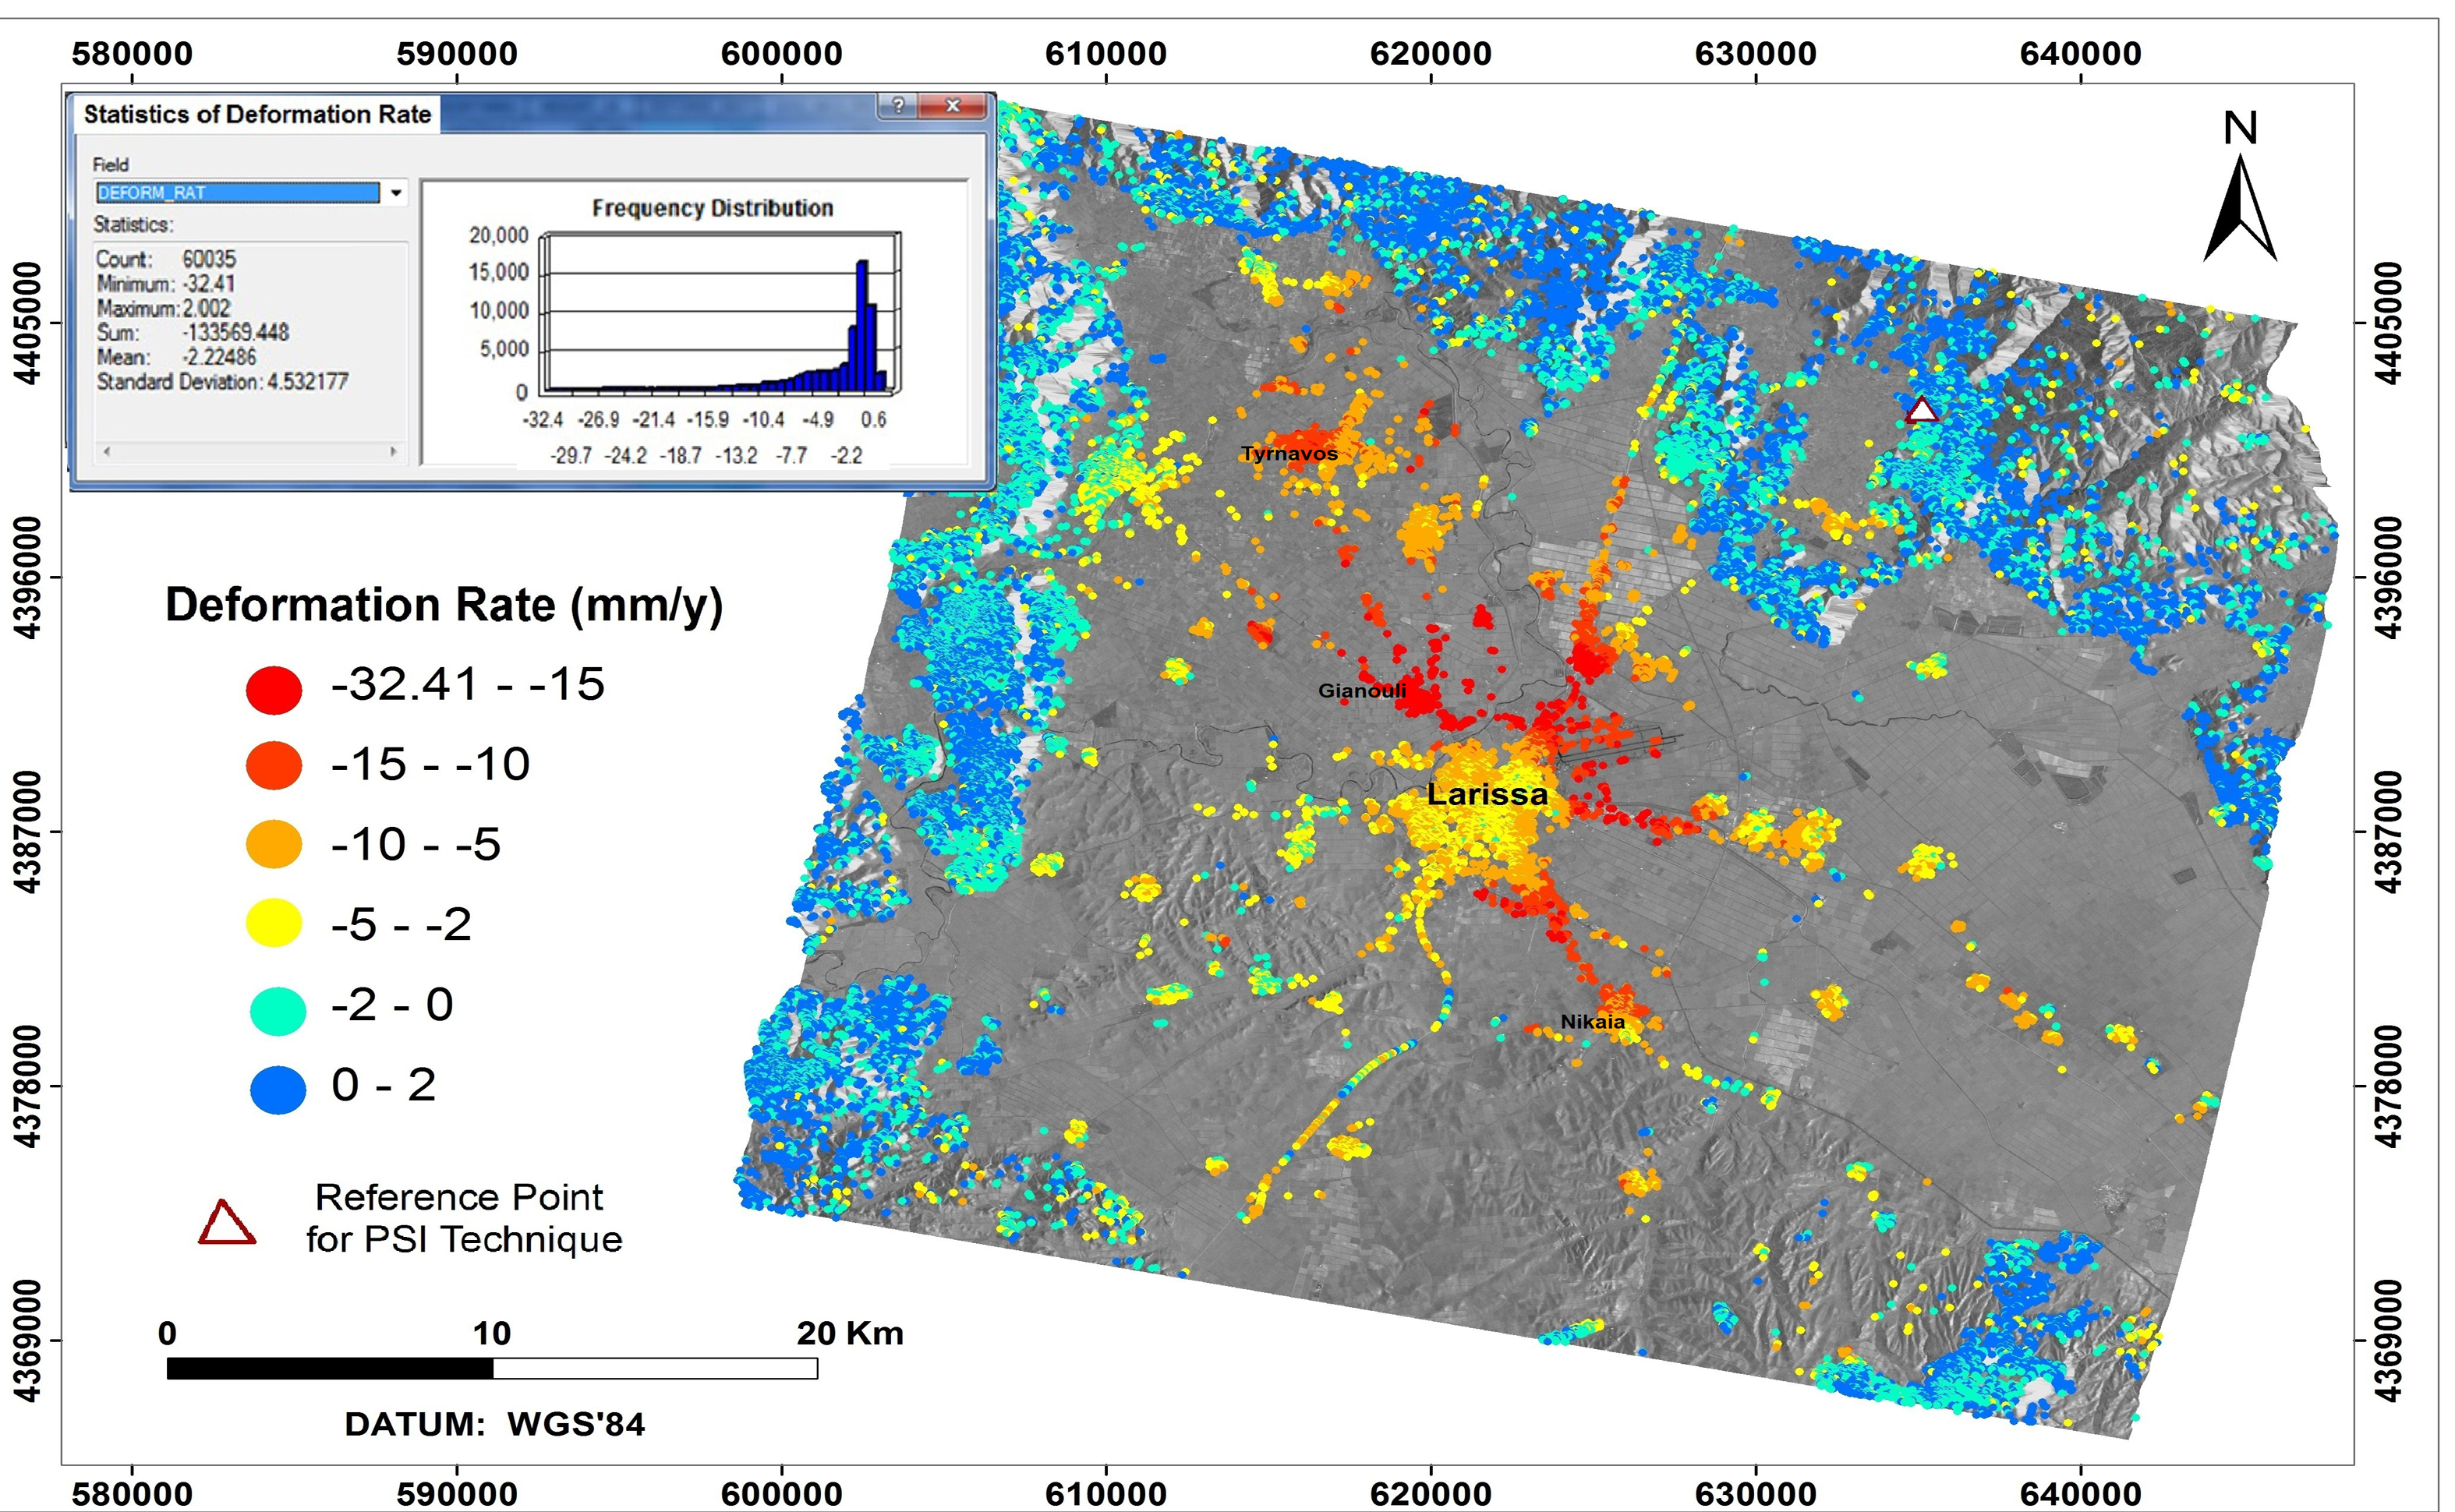
Ground Deformation Map of the broader area of Larissa Plain based on the PSI InSAR technique using ERS and ENVISAT satellite radar images ranging from November 1992 to February 2006. The classification of the deformation rate in categories was given according to statistical analysis of the deformation rate.
Profiles of Displacement (Fig. 20)

The displacement (in mm along the X Axis) after PSI processing in relation to the time (14 years from 1992 to 2006 along the Y Axis) for different selective points is shown in the above diagrams called ”Time Series of the Deformation”. The maximum subsidence takes place during spring-summer period while in the winter time the subsidence generally is decreased. The diagrams were created using the PROANA s/w.
Geological Map (Fig. 21)
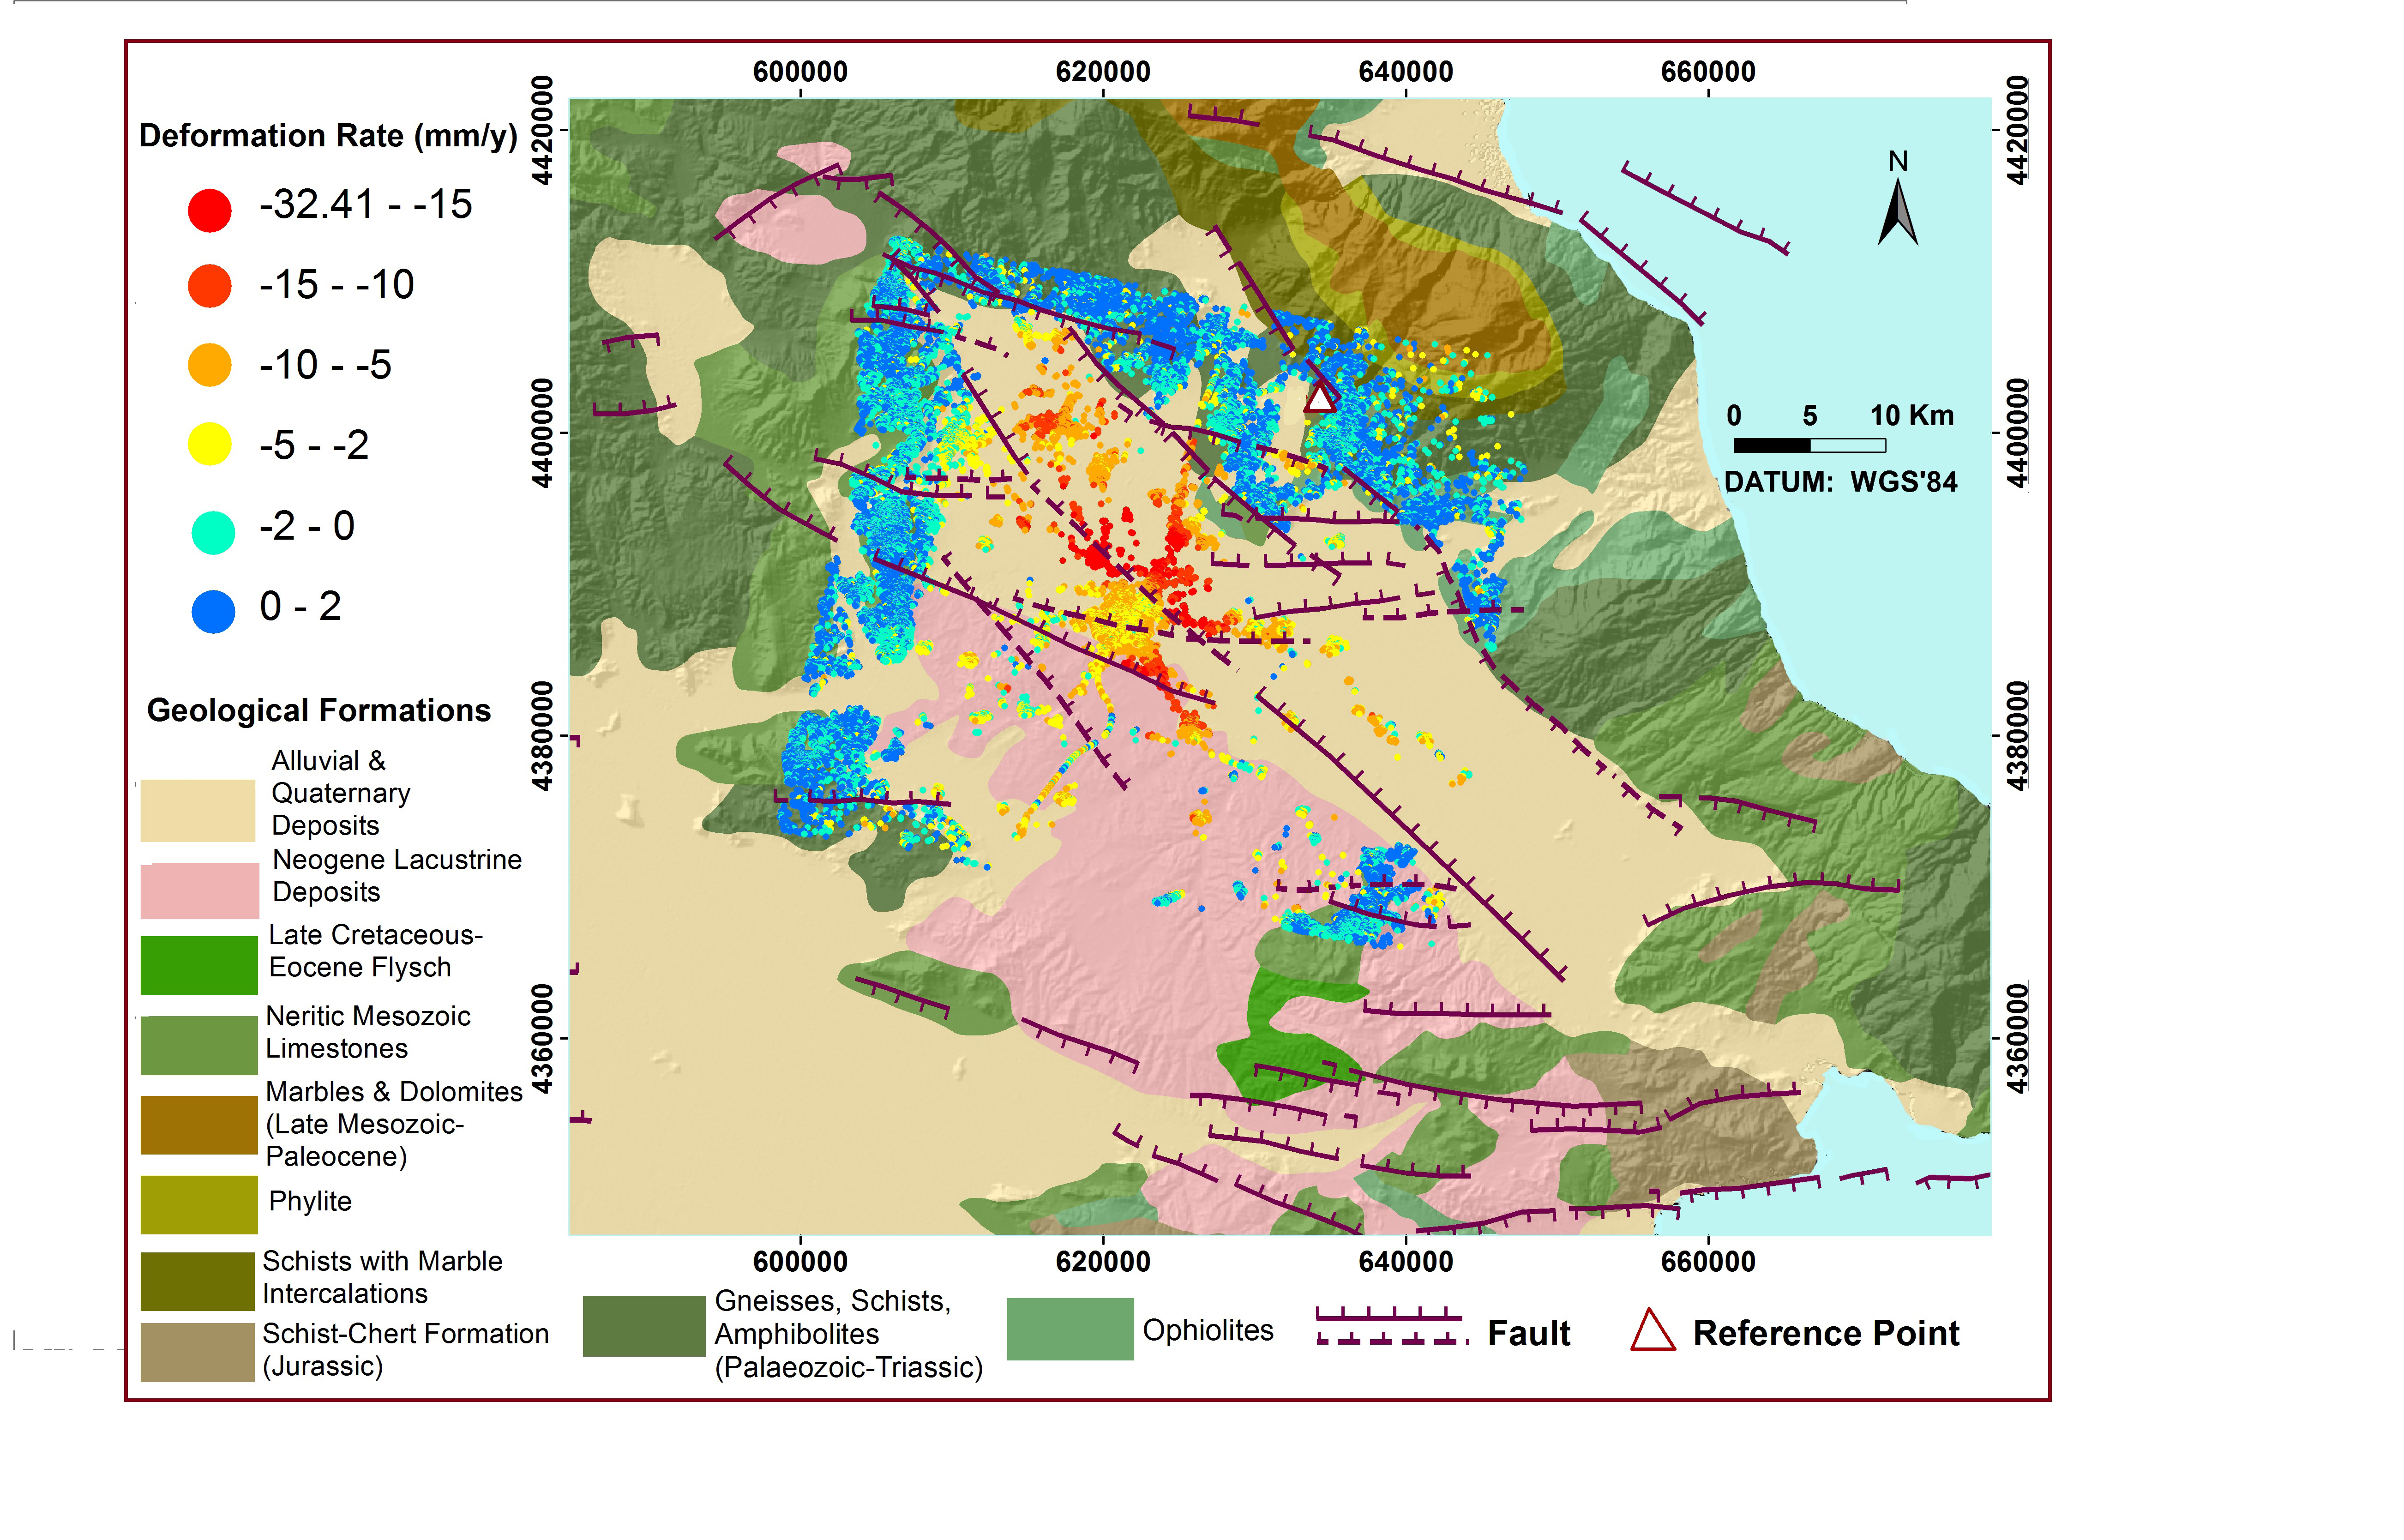
The geological structure of the broader area of Larissa Plain is given according to Athanassiou (2002). Alluvial and Quaternary deposits, Post-Alpine and Alpine formations cover the study area. The thematic layer was produced using ArcGIS 10 and is included together with other thematic and synthetic data and diagrams in the database corresponding to their correlation and analysis.
References
Athanassiou, A. (2002). Neogene and Quaternary mammal faunas of Thessaly. Annales Géologiques des Pays Helléniques, XXXIX (A), 279-293.
The TERRAFIRMA-1 Project terrafirma.eu.com.
Vassilopoulou, S., Sakkas, V., Wegmüller, U., Capes, R. (2013): Long Term and Seasonal Ground Deformation Monitoring of Larissa Plain (Central Greece) by Persistent Scattering Interferometry. Cent. Eur. J. Geosci. 5(1), 61-76.
Area 4 : ZAKYNTHOS ISLAND
The broader area of Zakynthos is a geologically and seismo-tectonically very complex region, which may be considered as a key area for a better understanding of the processes related with the collision of the African and Eurasian plates. The regional crustal deformation along the entire Ionian Sea and Western Greece has been studied through repeat Differential Global Positioning System (DGPS) measurements.
However, additional monitoring of dense GPS networks in such an active area may yield useful information regarding local ground deformation and kinematics. For that reason, a local GPS network was installed in the island of Zakynthos in August 2005 by the University of Athens (Lagios et al., 2007). This network has been remeasured and the results of the processing of the GPS data were used by a Geographical Information System to produce ground deformation maps. A GIS Data Base was organized, and thematic and synthetic layers and maps were produced in a common projection system (Hellenic Geodetic Reference System’87 / HGRS’87). The Data Base can be updated with new data and used for easy conclusion-extraction, depending on the current needs.
Vertical and horizontal ground deformation maps were created using differential GPS measurements. Ground deformation data can be compiled with other data relating to topography, geology, tectonic, seismology, satellite images of Zakynthos Island and various synthetic maps relating to ground displacements, geology, tectonic, terrain analysis etc can be produced.
A 30m resolution Digital Elevation Model (DEM) has been created based on ASTER images, as well as thematic and synthetic layers and maps of terrain analysis (slope and aspect maps, planation surfaces, morphological discontinuities etc.) were extracted from the DEM.
Terrain Analysis
Shaded relief of Zakynthos Island (azimuth 450, altidute 450) based on 30m resolution DEM extracted from ASTER images. Faults are overlaid to the shaded relief.
Terrain Analysis Map of Zakynthos Island (Fig. 23)
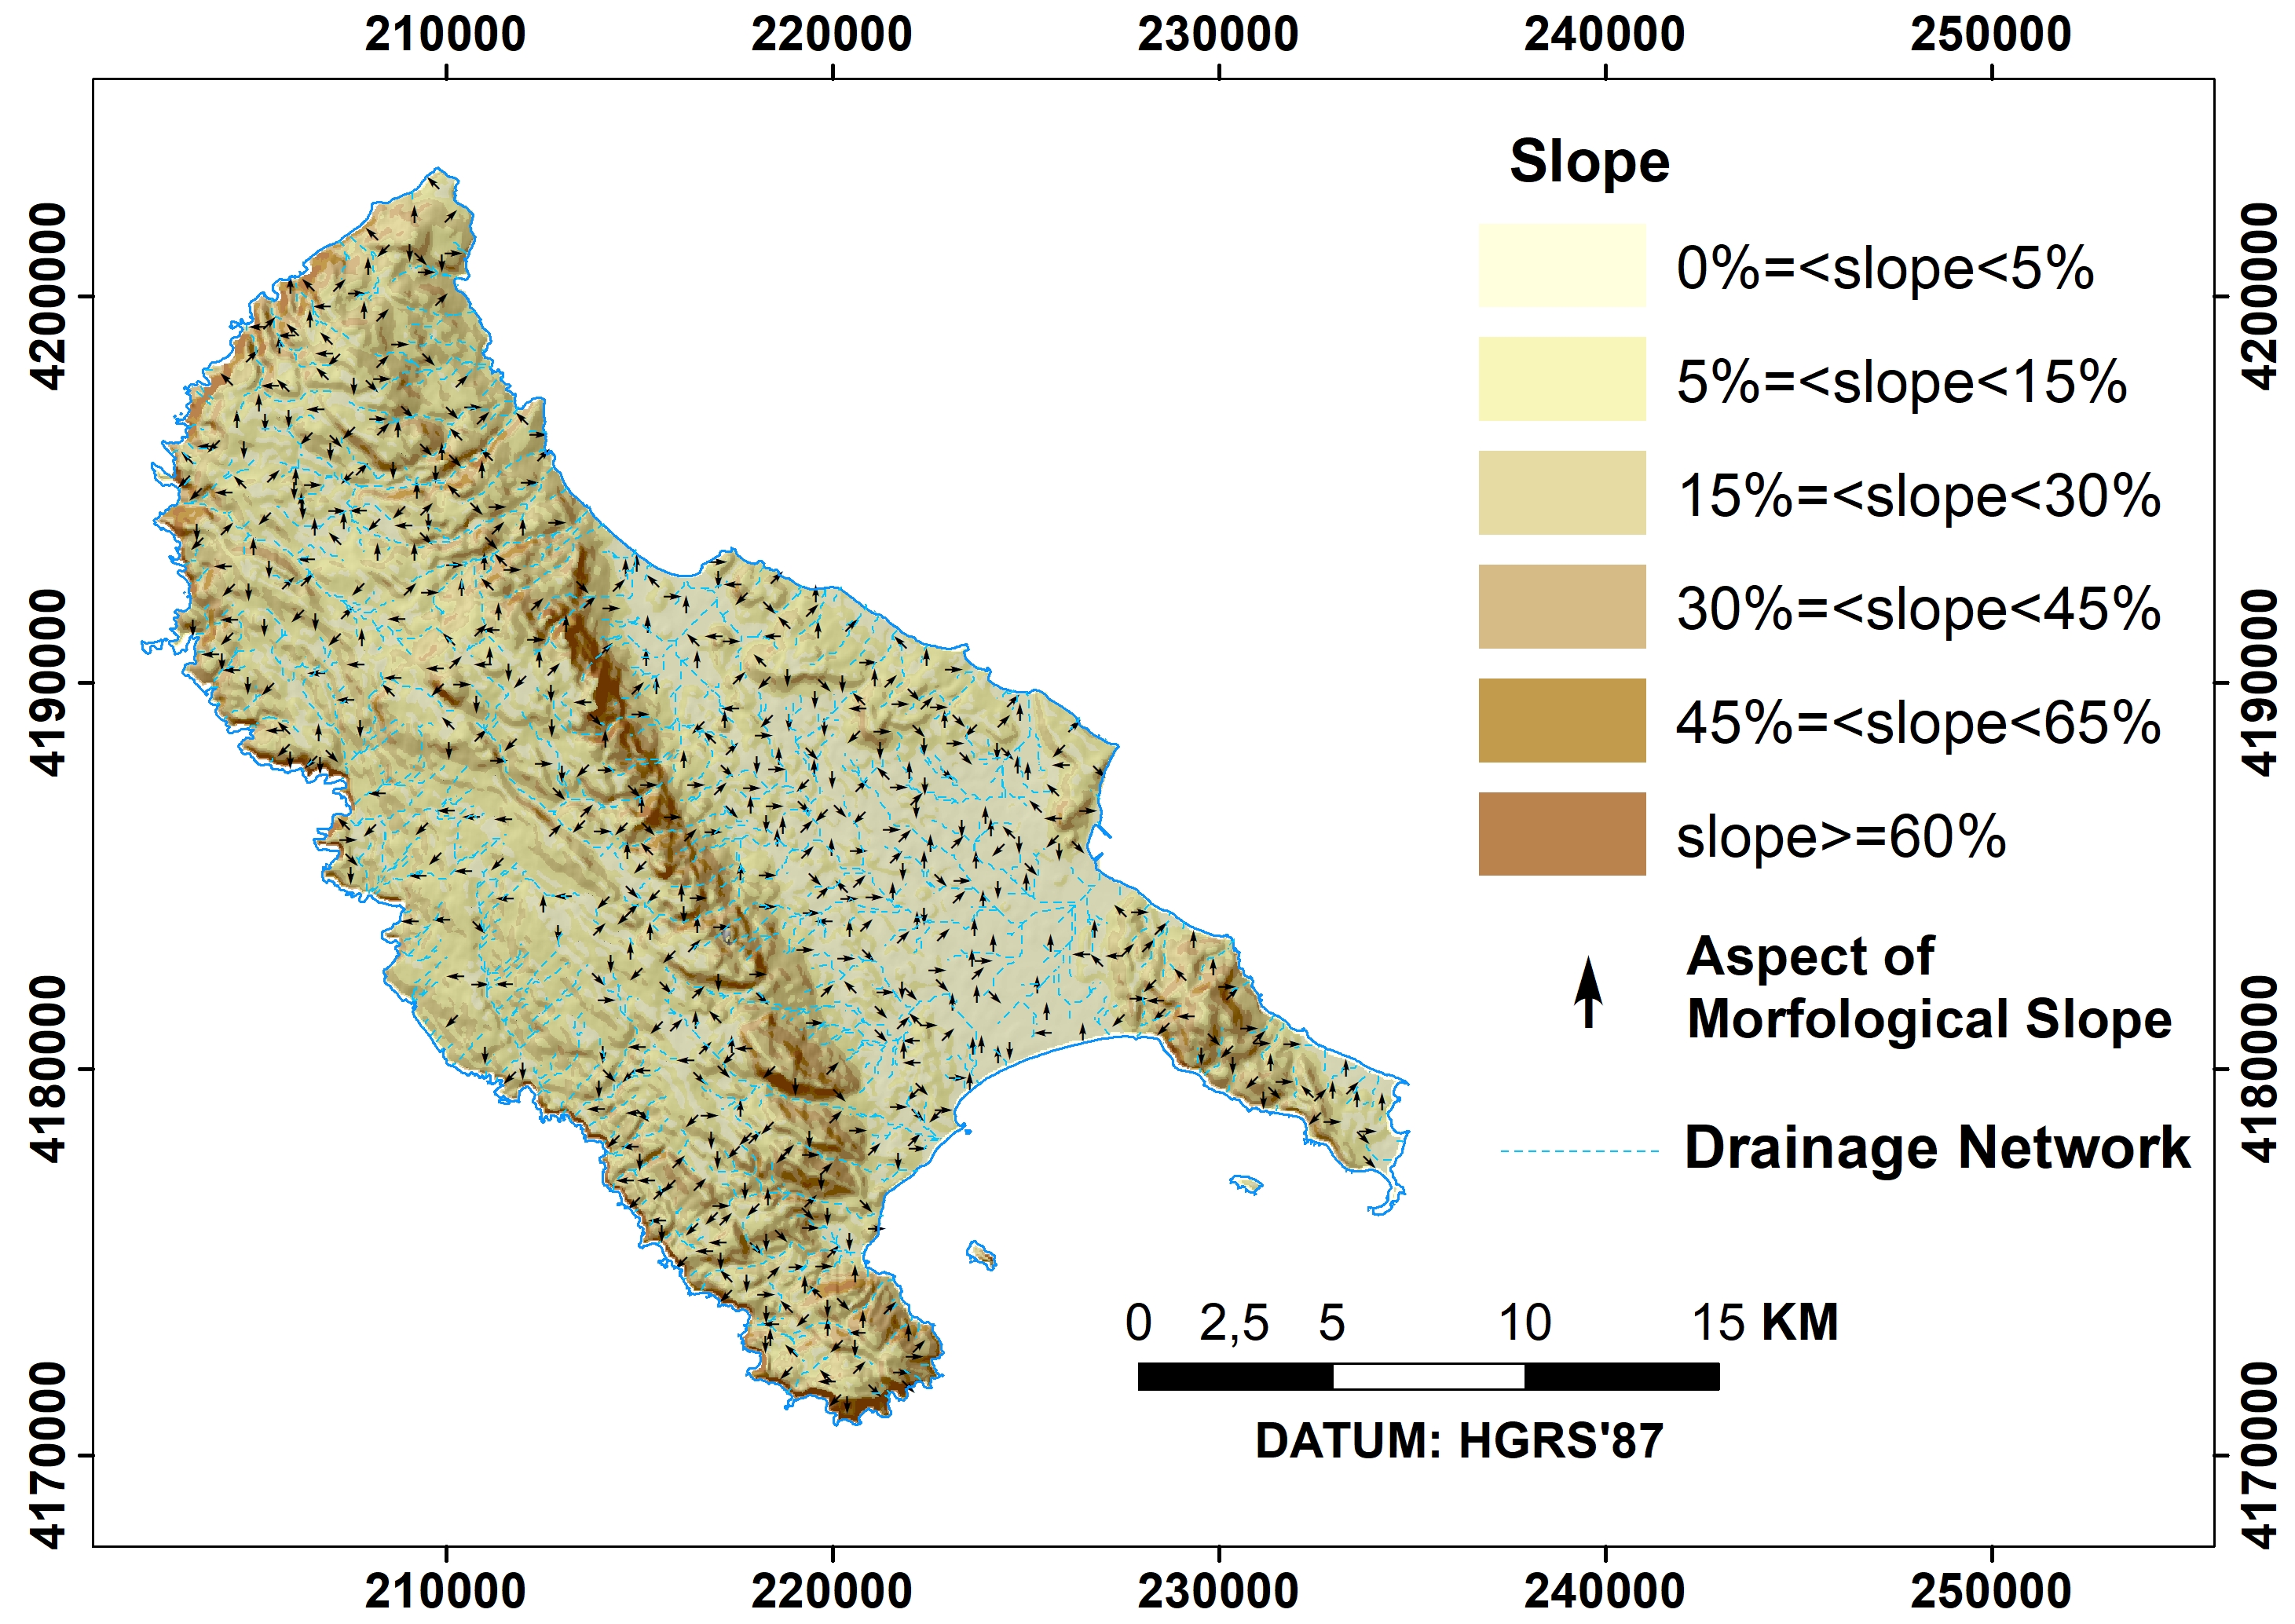
Morphological slopes of Zakynthos Island. The slopes are represented in a color scale from light yellow (small slopes) to dark brown (high slopes). The aspect of slopes is illustrated as arrows. The layer of faults is overlaid to the morphological slopes.
Ground Deformation
Ground deformation studies based on satellite geodetic measurements (GPS/GNSS) have been proved a unique tool to measure ground deformation in seismically active areas aiming to study the tectonic motions associated with earthquake procedures. The Central Ionian Islands is an area of high seismicity accompanied with large ground deformation due to the intense tectonic activity occurring in the area. In order to measure pre- co- and post-seismic activity in this area several local GPS networks have been established since 2001 covering the islands of Cephalonia, Ithaca and Zakynthos. The GPS network (14 stations) in Zakynthos was first installed in 2005 and re-measured in 2006, 2012, 2015, May 2018 and after the earthquake November 2018. Overall rms errors of about 1.0-7.0 mm and 2.0-8.1 mm for the horizontal and vertical components of displacement, respectively, were achieved for the majority of the stations (at a 90% confidence level) using the Bernese v5.2 software. Station No. 73 was chosen as a local reference station for the periods prior to 2010. The GPS stations are located on the main tectonic blocks and fault zones that could be recognized in the island and they are distributed accordingly for the study of the tectonic deformation. Generally, the stations are located at about the centre of the main tectonic blocks and are separated by 10 km or less. This spacing is sufficient for detailed monitoring of local and regional tectonic movements.
Late 2013 a continuous GNSS site has been established by METRICA SA in the city of Zakynthos, and since then this site has been used as local reference station, showing a velocity vector with respect to ITRF2008 (VEast=12.7±1.1 mm/yr and VNorth=-3.1±0.7 mm/yr) that is consistent with the anticipated regional motion (Hollenstein et al. 2008). For the first re-measurement periods 2005-2015, the horizontal deformation is consistent with the anticipated southwestern motion of the area with respect to the ITRF. However, at the northern half of the island, the vectors show a westward motion (about 80 mm), while to the south a southwestern motion of the same amplitude prevails. The vertical deformation shows significant subsidence for the whole of the island. The strong differentiation in the motion between the northern and the southern parts of the island, observed mainly in the first re-measurement period (2005-2006), but also in the second period (2006-2015), highlights the different kinematic status of the two areas, as has been described from Lagios et al. 2007.
Periods of GPS Measurements
Horizontal and vertical deformation of Zakynthos Island (August 2005 to July 2006) (Fig. 24)
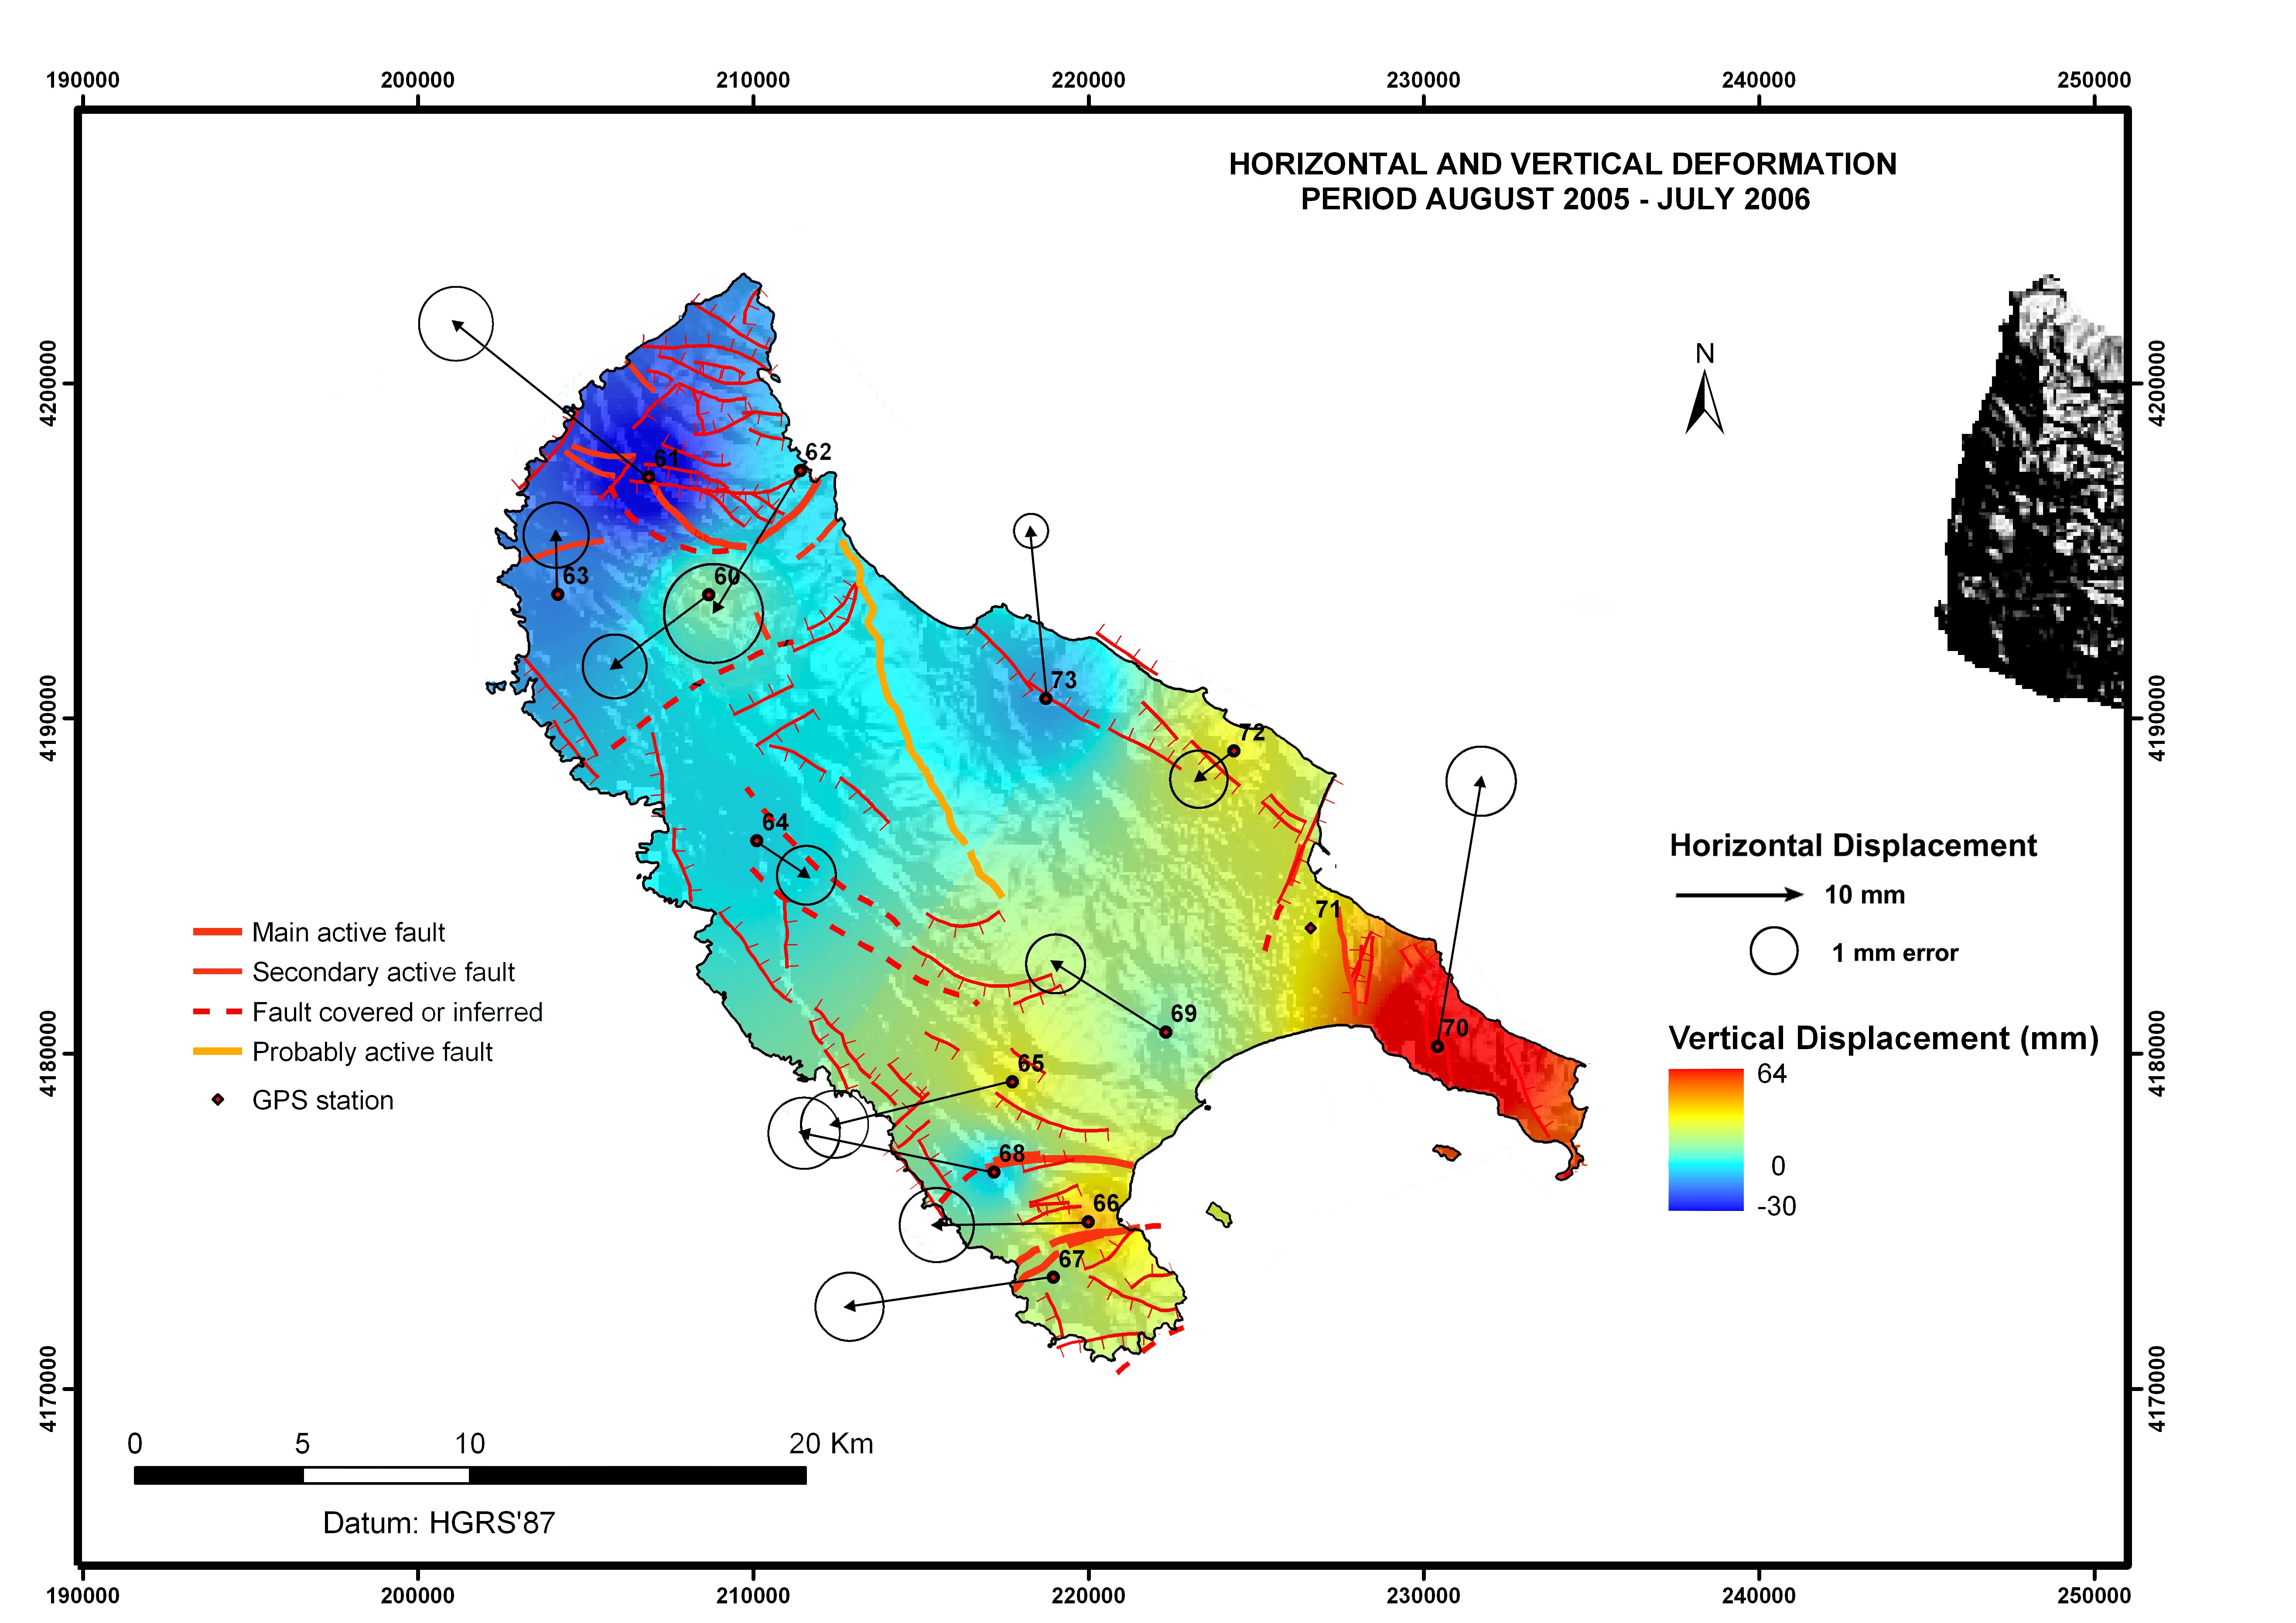
A horizontal extension of the southern part of the island has occurred in the area around Laganas Bay which seems to be “opening”: Its western part showed generally a westerly motion ranging from 15-20 mm, while its eastern part had magnitude of 26 mm towards the NNE. The central part of the island appears stable. The northern part, however, presents an inconsistent pattern with two stations (No 60 and 62) having directions to the SW, while the most northerly ones, No 61 and 63, have orientations to the NW and N with magnitudes of 24 mm and 5 mm, respectively.
The vertical deformation is expressed with uplift mostly in the southern part bounding the area of Laganas Bay with values of 40 mm and 60 mm in the western and eastern parts, respectively. More than 60 mm occurred at station No 70. The extreme northern part (No 61 and 63) had subsided by 12-30 mm, while the section to its SE (No 60 and 62) was unchanged.
References
HMGS, 1976. Topographical Map of Greece (Zakynthos & Volimai sheet), scale 1:50000
Hollenstein, CH., Müller,M.D., Geiger, A., Kahle H.-G. 2008. Crustal motion and deformation in Greece from a decade of GPS measurements, 1993–2003. Tectonophysics, 449, 17-40.
Lagios, E., Sakkas, V., Papadimitriou, P., Parcharidis, I., Damiata, B.N., Chousianitis, K., Vassilopoulou, S. 2007. Crustal deformation in the Central Ionian Islands (Greece): Results from DGPS and DInSAR analyses (1995-2006). Tectonophysics, 444 (1-4), 119-145.
V. Sakkas, K. Pavlou, S. Vassilopoulou, E. Lagios (2019). GPS Networks in Seismically Active Areas of Western Greece: The Case of Zakynthos Earthquake (Mw=6.8) of October 25, 2018. 15th International Congress of the Geological Society of Greece, Athens, 22-24 May, 2019. Sp. Publ., Ext. Abs.
Vassilopoulou S., Chousianitis K., Sarantidis, A., Oikonomou A., Sakkas V., Damiata, B.N. And Lagios E. (2007): Development of a GIS System to Analyze Ground and Satellite Data of Zakynthos Island. (Proceedings of the 8th Hellenic Geographical Congress, Athens, 4-7 October, 2007, 2, 13-23).
Area 5 : ATALANTI FAULTING ZONE (AFZ)
Ground Deformation
The northern Evoikos Gulf (100 km long) is a NW-SE trending graben that separates North Evoia Island from Central Greece - an active tectonic area. The AFZ is located in the western part of the southern margin of the Evoikos Gulf and extends over a distance of about 90 km from Kamena Vourla to the NW to Martino town to the SE. Distractive earthquakes occurred in the area since ancient times.
The detection of possible seismic precursors and the ground deformation of the broader area of AFZ was investigated during the period 2001-2003, using ground and space techniques. This multidisciplinary study included the collection, processing and analysis of the various type of data relating to topography, geology, tectonics, seismicity, DGPS measurements and Differential SAR Interferometry.
To study the crustal deformation, a GPS network was established in the area in 2001 and re-measured in 2002. The GPS Network consists of 20 stations distributed along the Atalandi Faulting Zone, with an average station spacing of about 5-8 km. The network has been referenced to the Dionysos permanent station which is located in the Athens area (about 100 km SSE). Additionally, a station located at the center of the network in Atalanti town was chosen as a local reference in order to determine ground deformation relative to that station.
A qualitive and quantitative image of the ground deformation in Atalanti area is presented with reference to Atalanti central station. The area can be divided in three zones of deformation according to the character of the ground deformation vector.
The DGPS results for the period 2001-2002 show that the AFZ has a complex form. Although it appears linear it consists of a large number of smaller fault segments that their interaction cannot fully be identified. Nevertheless, it is clear that the different segments strongly affect each other.
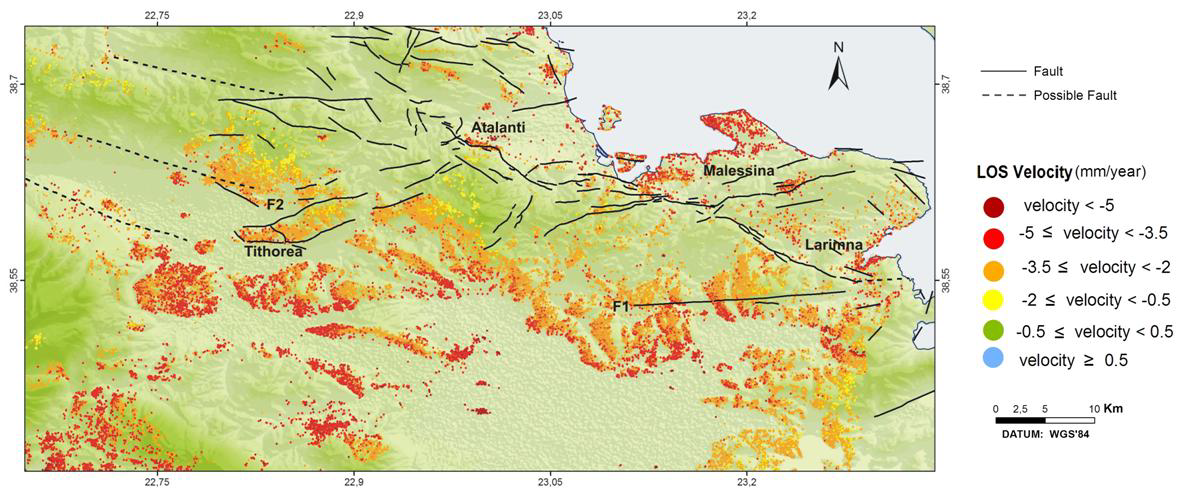
The Persistent Scatterer Interferometry Wide Area Product (PSI-WAP) based on ERS1 & ERS2 radar data has also been used to spatially and temporally study the ground deformation for the period 1992-2003. The observed LOS velocity field, with values ranging between -0.5 to -5.0mm/yr, combined with small standard deviation velocity values reveals an almost linear type of ground deformation.
The most intense subsidence was associated to alluvia deposits and man made activities (intense water pumping). Differential motions along the main faulting zones have also been clearly identified. GPS results reflected a similar pattern of motions (subsidence) with the identified interferometric image. The recorded seismicity in the area is not significant for the PSI-WAP period. The micro-seismic activity (M < 3) is mainly confined peripherally and does not seem to confidently affect the observed ground deformation.
Ground Deformation Map based on GPS Measurements (2001 – 2002) (Fig.25)
PSI-WAP Image in the broader area of Atalanti (Central Greece) for the period November 1992 to October 2003 (Fig.26)
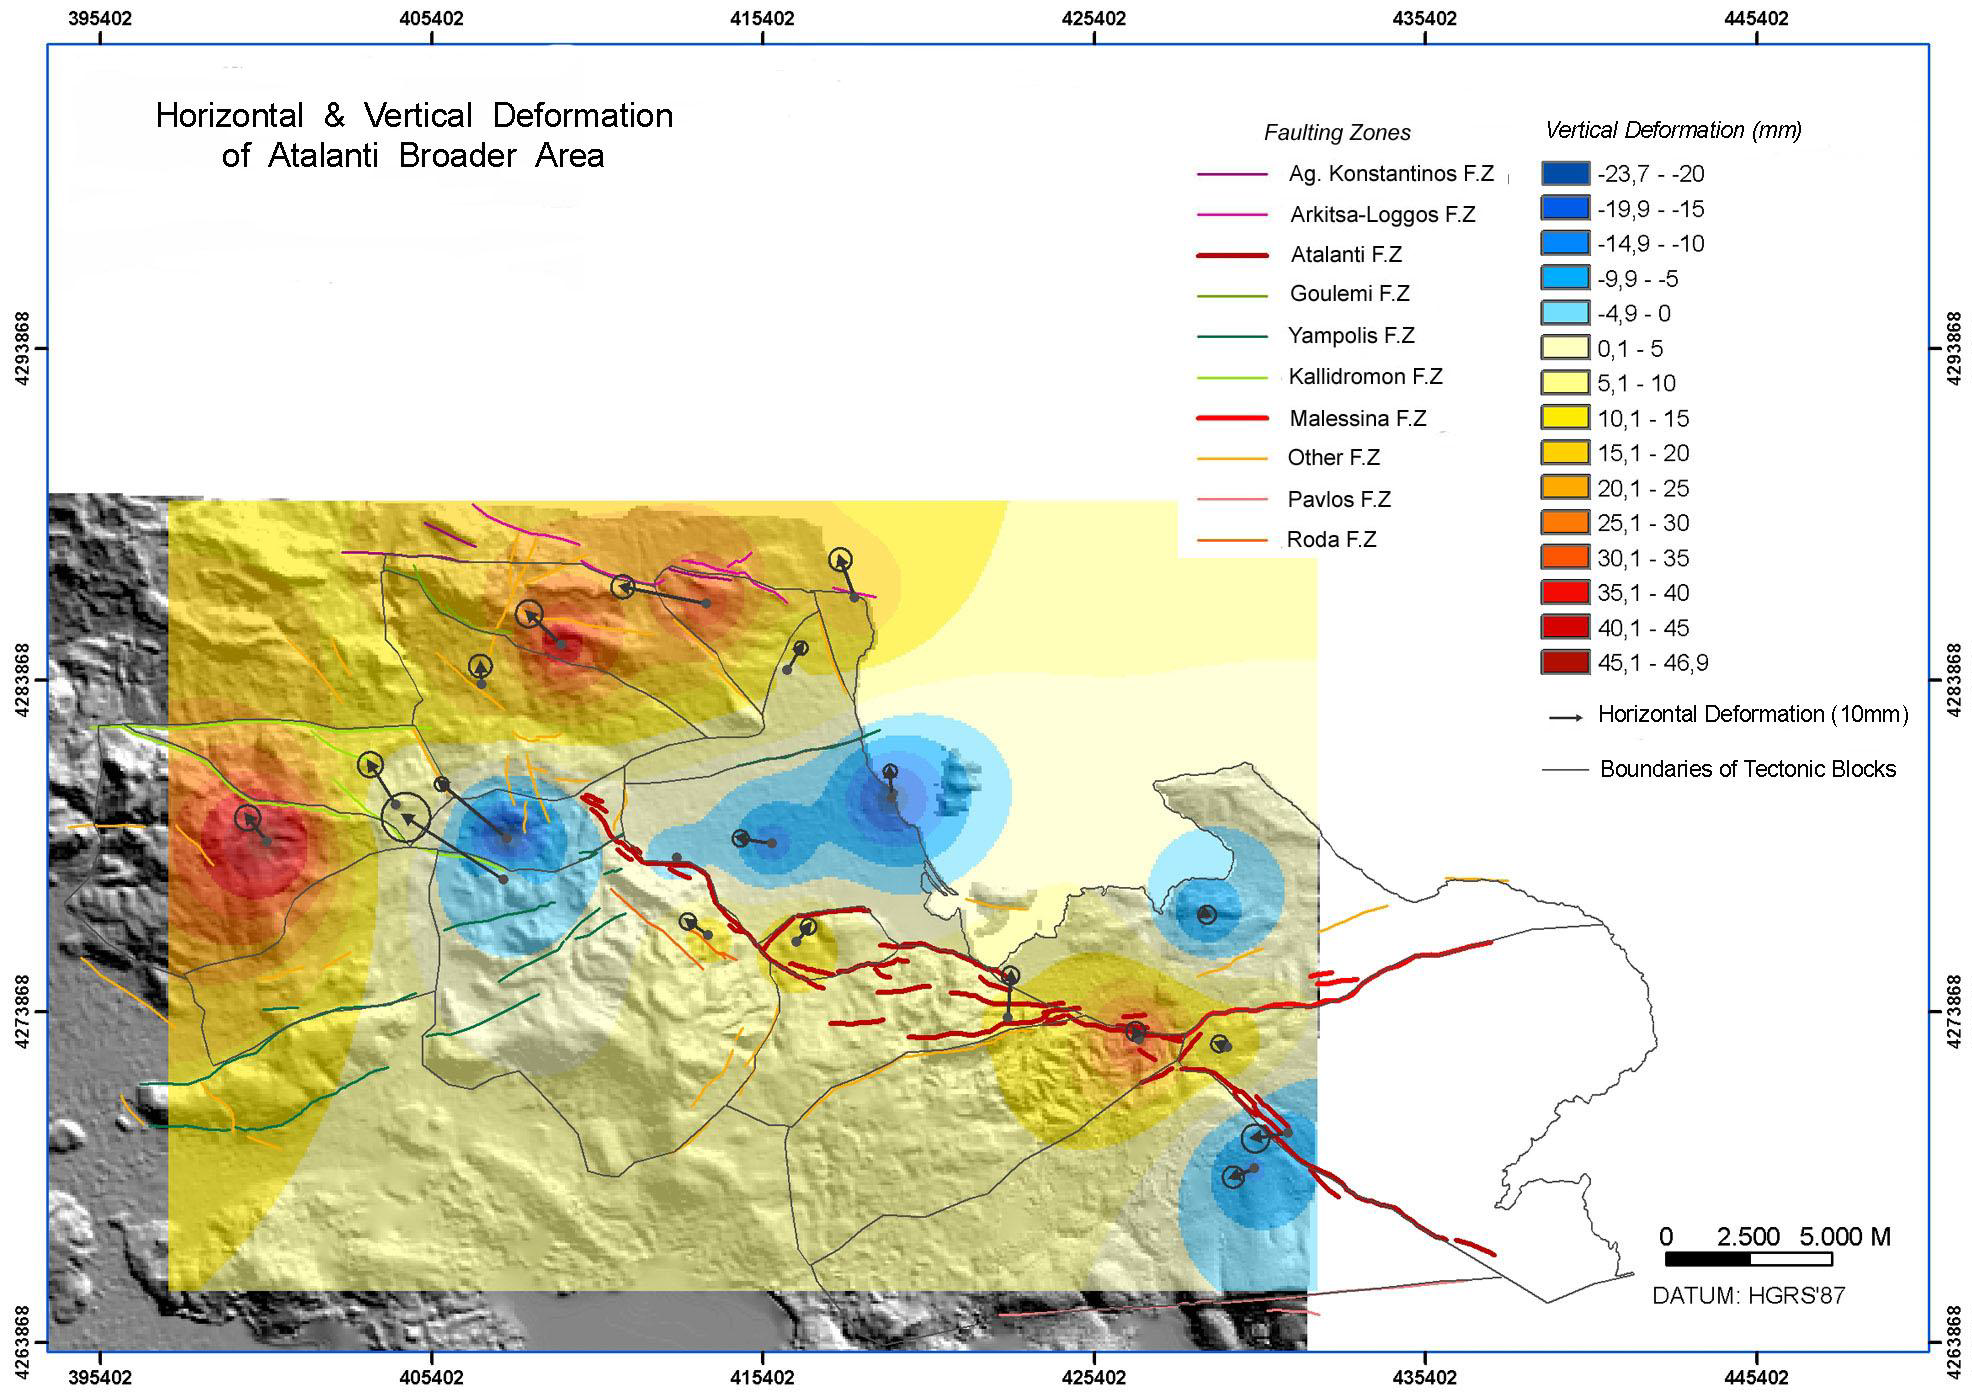
Ground Deformation Map of the broader Area of AFZ (Fig. 27).
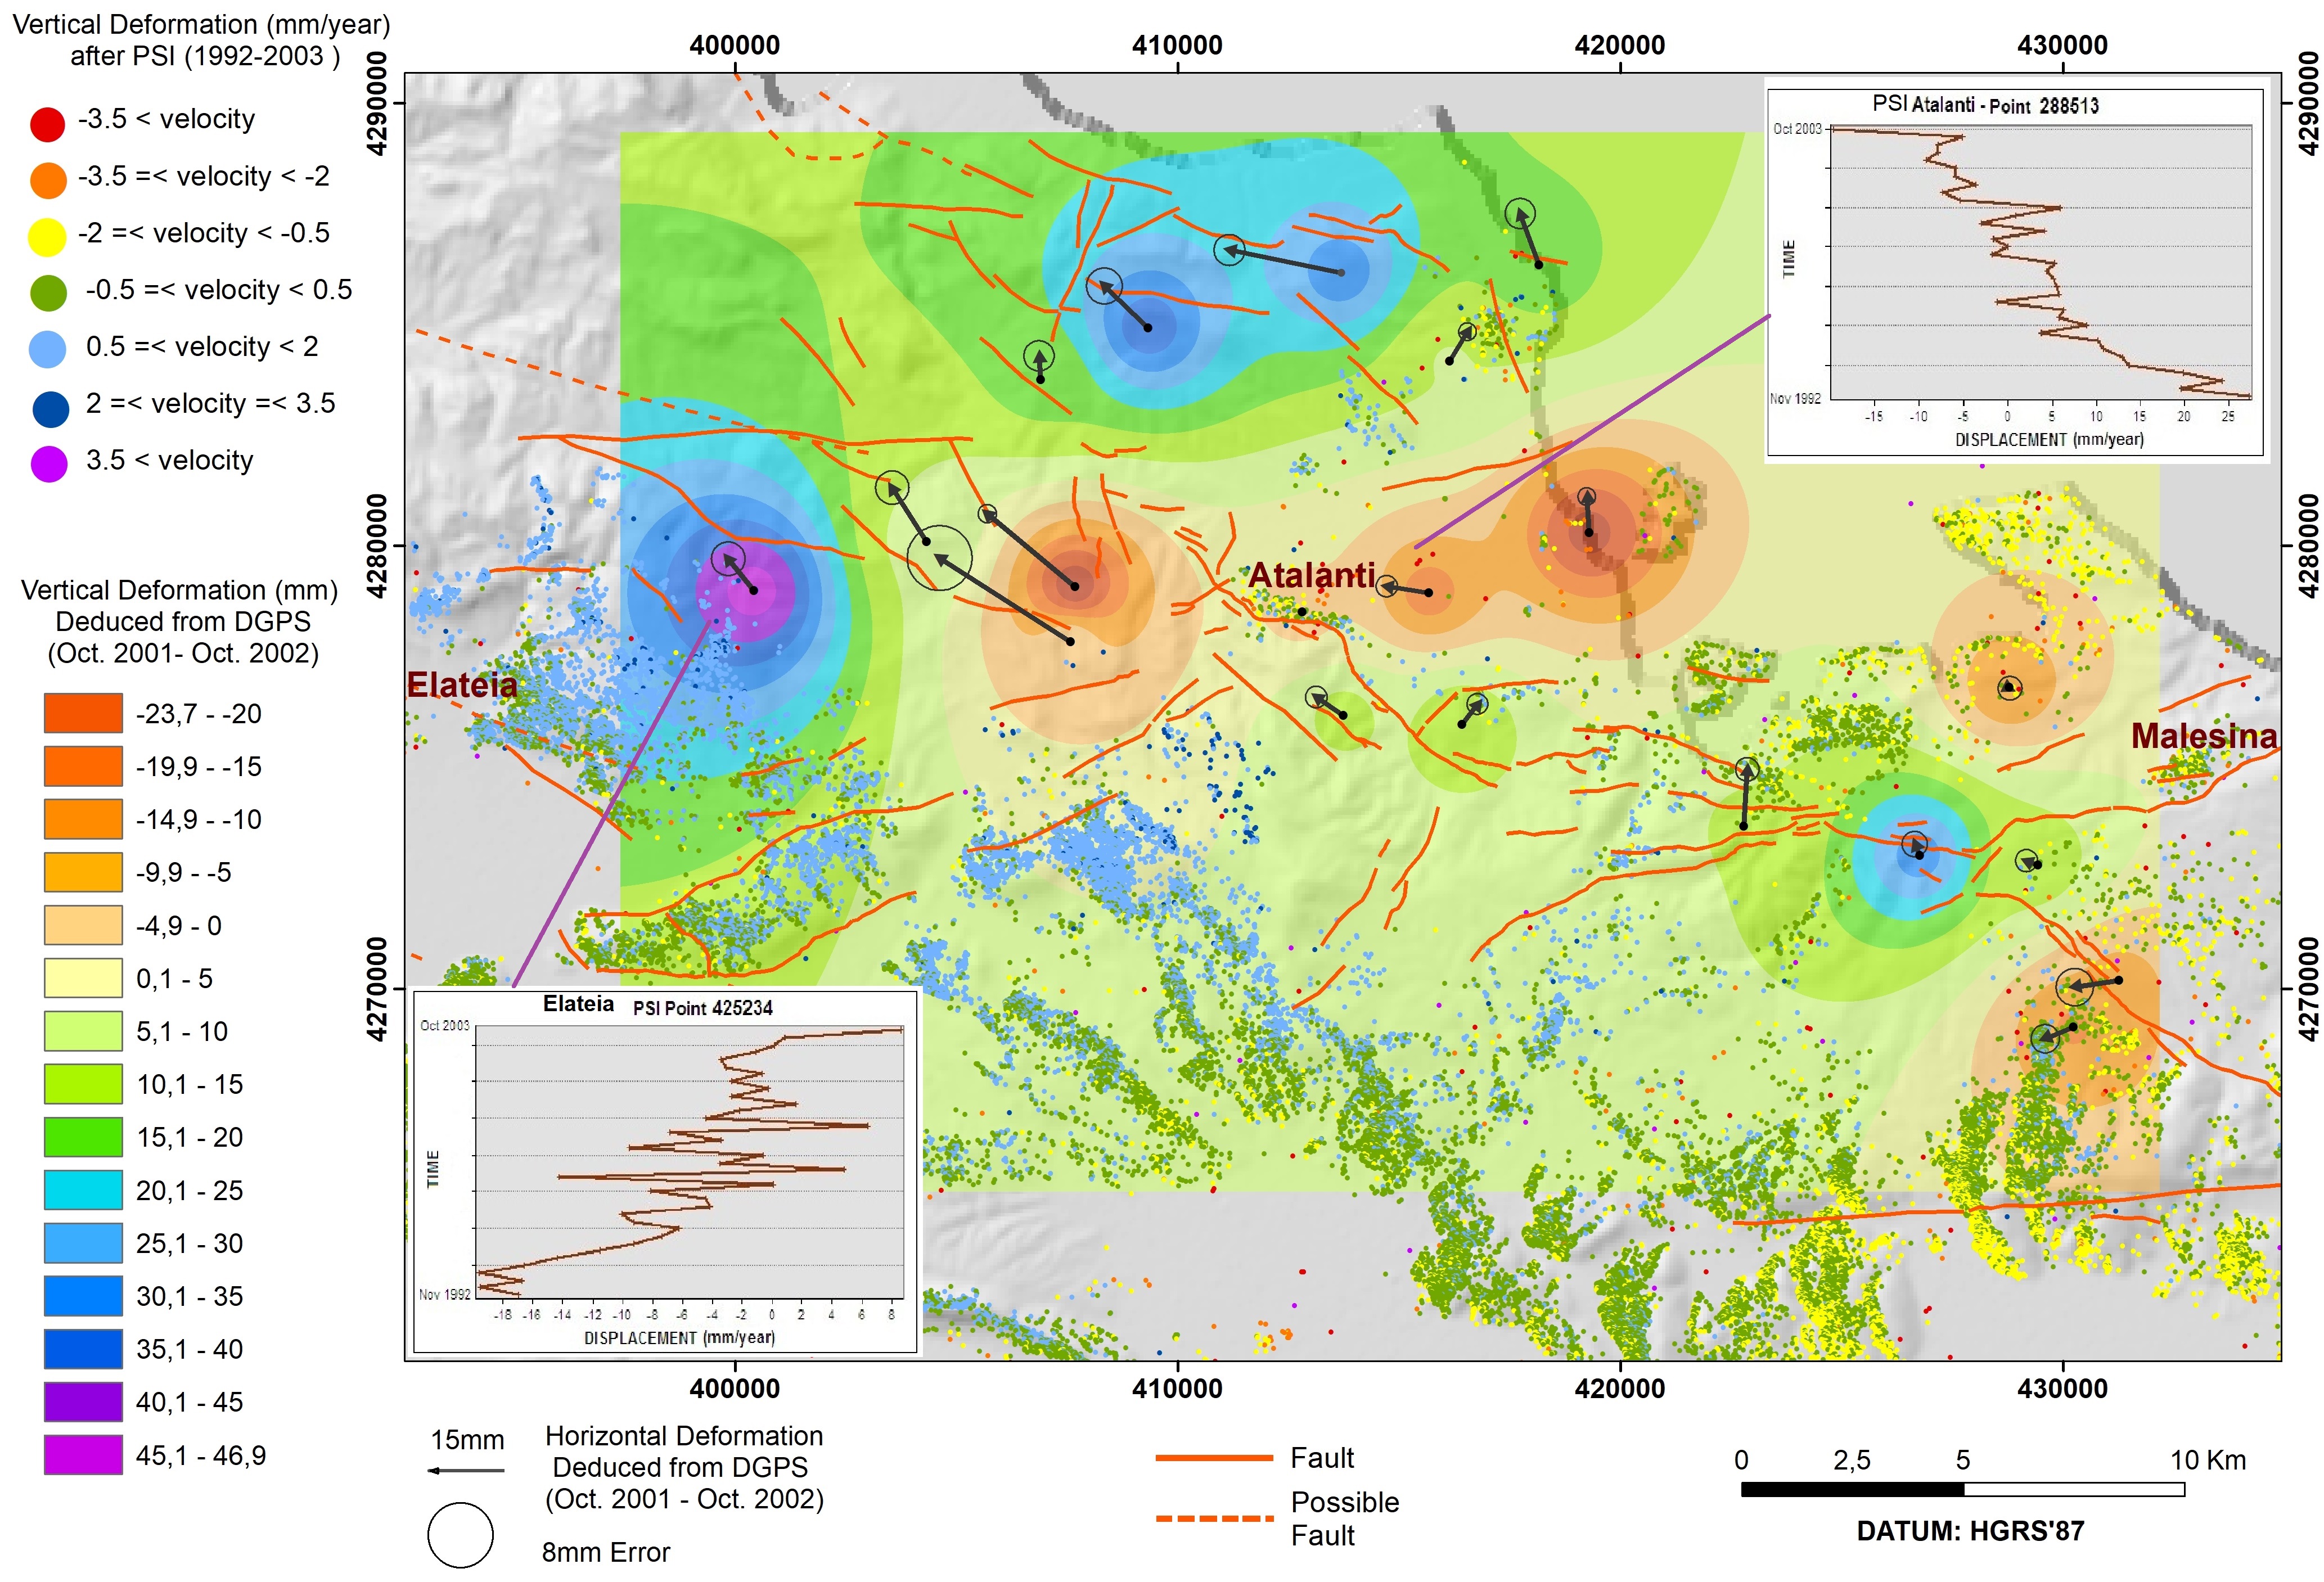
The deformation is based on GPS measurements and PSI InSAR technique. The horizontal and vertical deformation by GPS measurement is given using GDM-Tool. A station in the center of the network (Atalanti) was used as local reference station in order to better observe local tectonic motions. The Displacement (in mm along the X Axis) after PSI processing in combination to the Time (along the Y Axis), is given for different selective points automatically, using GDM-Tool software.
References
“Multi-disciplinary studies in the Broader Area of Atalanti Fault (Greece)”. NKUA, 2001-2002.
The Terrafirma Project terrafirma.eu.com
V. Sakkas, M. Pirli, S. Vassilopoulou, G. Kaviris, C. Kranis, N. Voulgaris, P. Papadimitriou, E. Lagios, and K. Makropoulos, “Crustal Deformation in the Broader Atalanti Area (Greece)”, XXIX General Assemply of the European Seismological Commission, Potsdam, Germany, Sept. 12-17, (abstract), 2004.
Sakkas V., Lagios E., Vassilopoulou S., Adam N. (2015). Ground Deformation in the Broader Area of the Atalanti Fault Zone (Central Greece) Based On GPS & PSI-WAP. Geosciences and Remote Sensing Symposium (IGARSS) 2015 IEEE International, Milan Italy, pp. 4676-4679.
Area 6 : CEPHALLONIA
Western Greece comprises a seismo-tectonically complex area of rapid and intense deformation. Monitoring of dense GPS networks in such an active area may yield useful information regarding the study of local ground deformation and kinematics. The Differential GPS measurements were taken from 23 GPS stations spread over the island. The 23 stations of the Cephallonia GPS network were installed in October 2001 and expanded to Ithaka Island in 2004. The GPS network was re-measured several times, mainly following earthquakes.
The locations of the GPS stations were selected according to the main tectonic blocks and faulting zones that could be recognized in the island, and they were distributed accordingly for the study of the tectonic deformation trigerred either by faulting or possible pre- and post- seismic activity. The average spacing of the stations were 10 km or less, a distance which is appropriate for a detailed monitoring of local and regional tectonic movements. A GIS Data Base have been developed including DGPS data as well as PSI measurements, geological, tectonic and seismological data for better management and analysis. The vertical and ground deformation maps deduced by GPS measurements, during specific periods, have been produced automatically using GDM-Tool.
Ground Deformation
Ground Deformation Map of Cephallonia Island (September 2001 - September 2003 following the Lefkas earthquake of August 2003 (Mw = 6.3) (Fig.28)
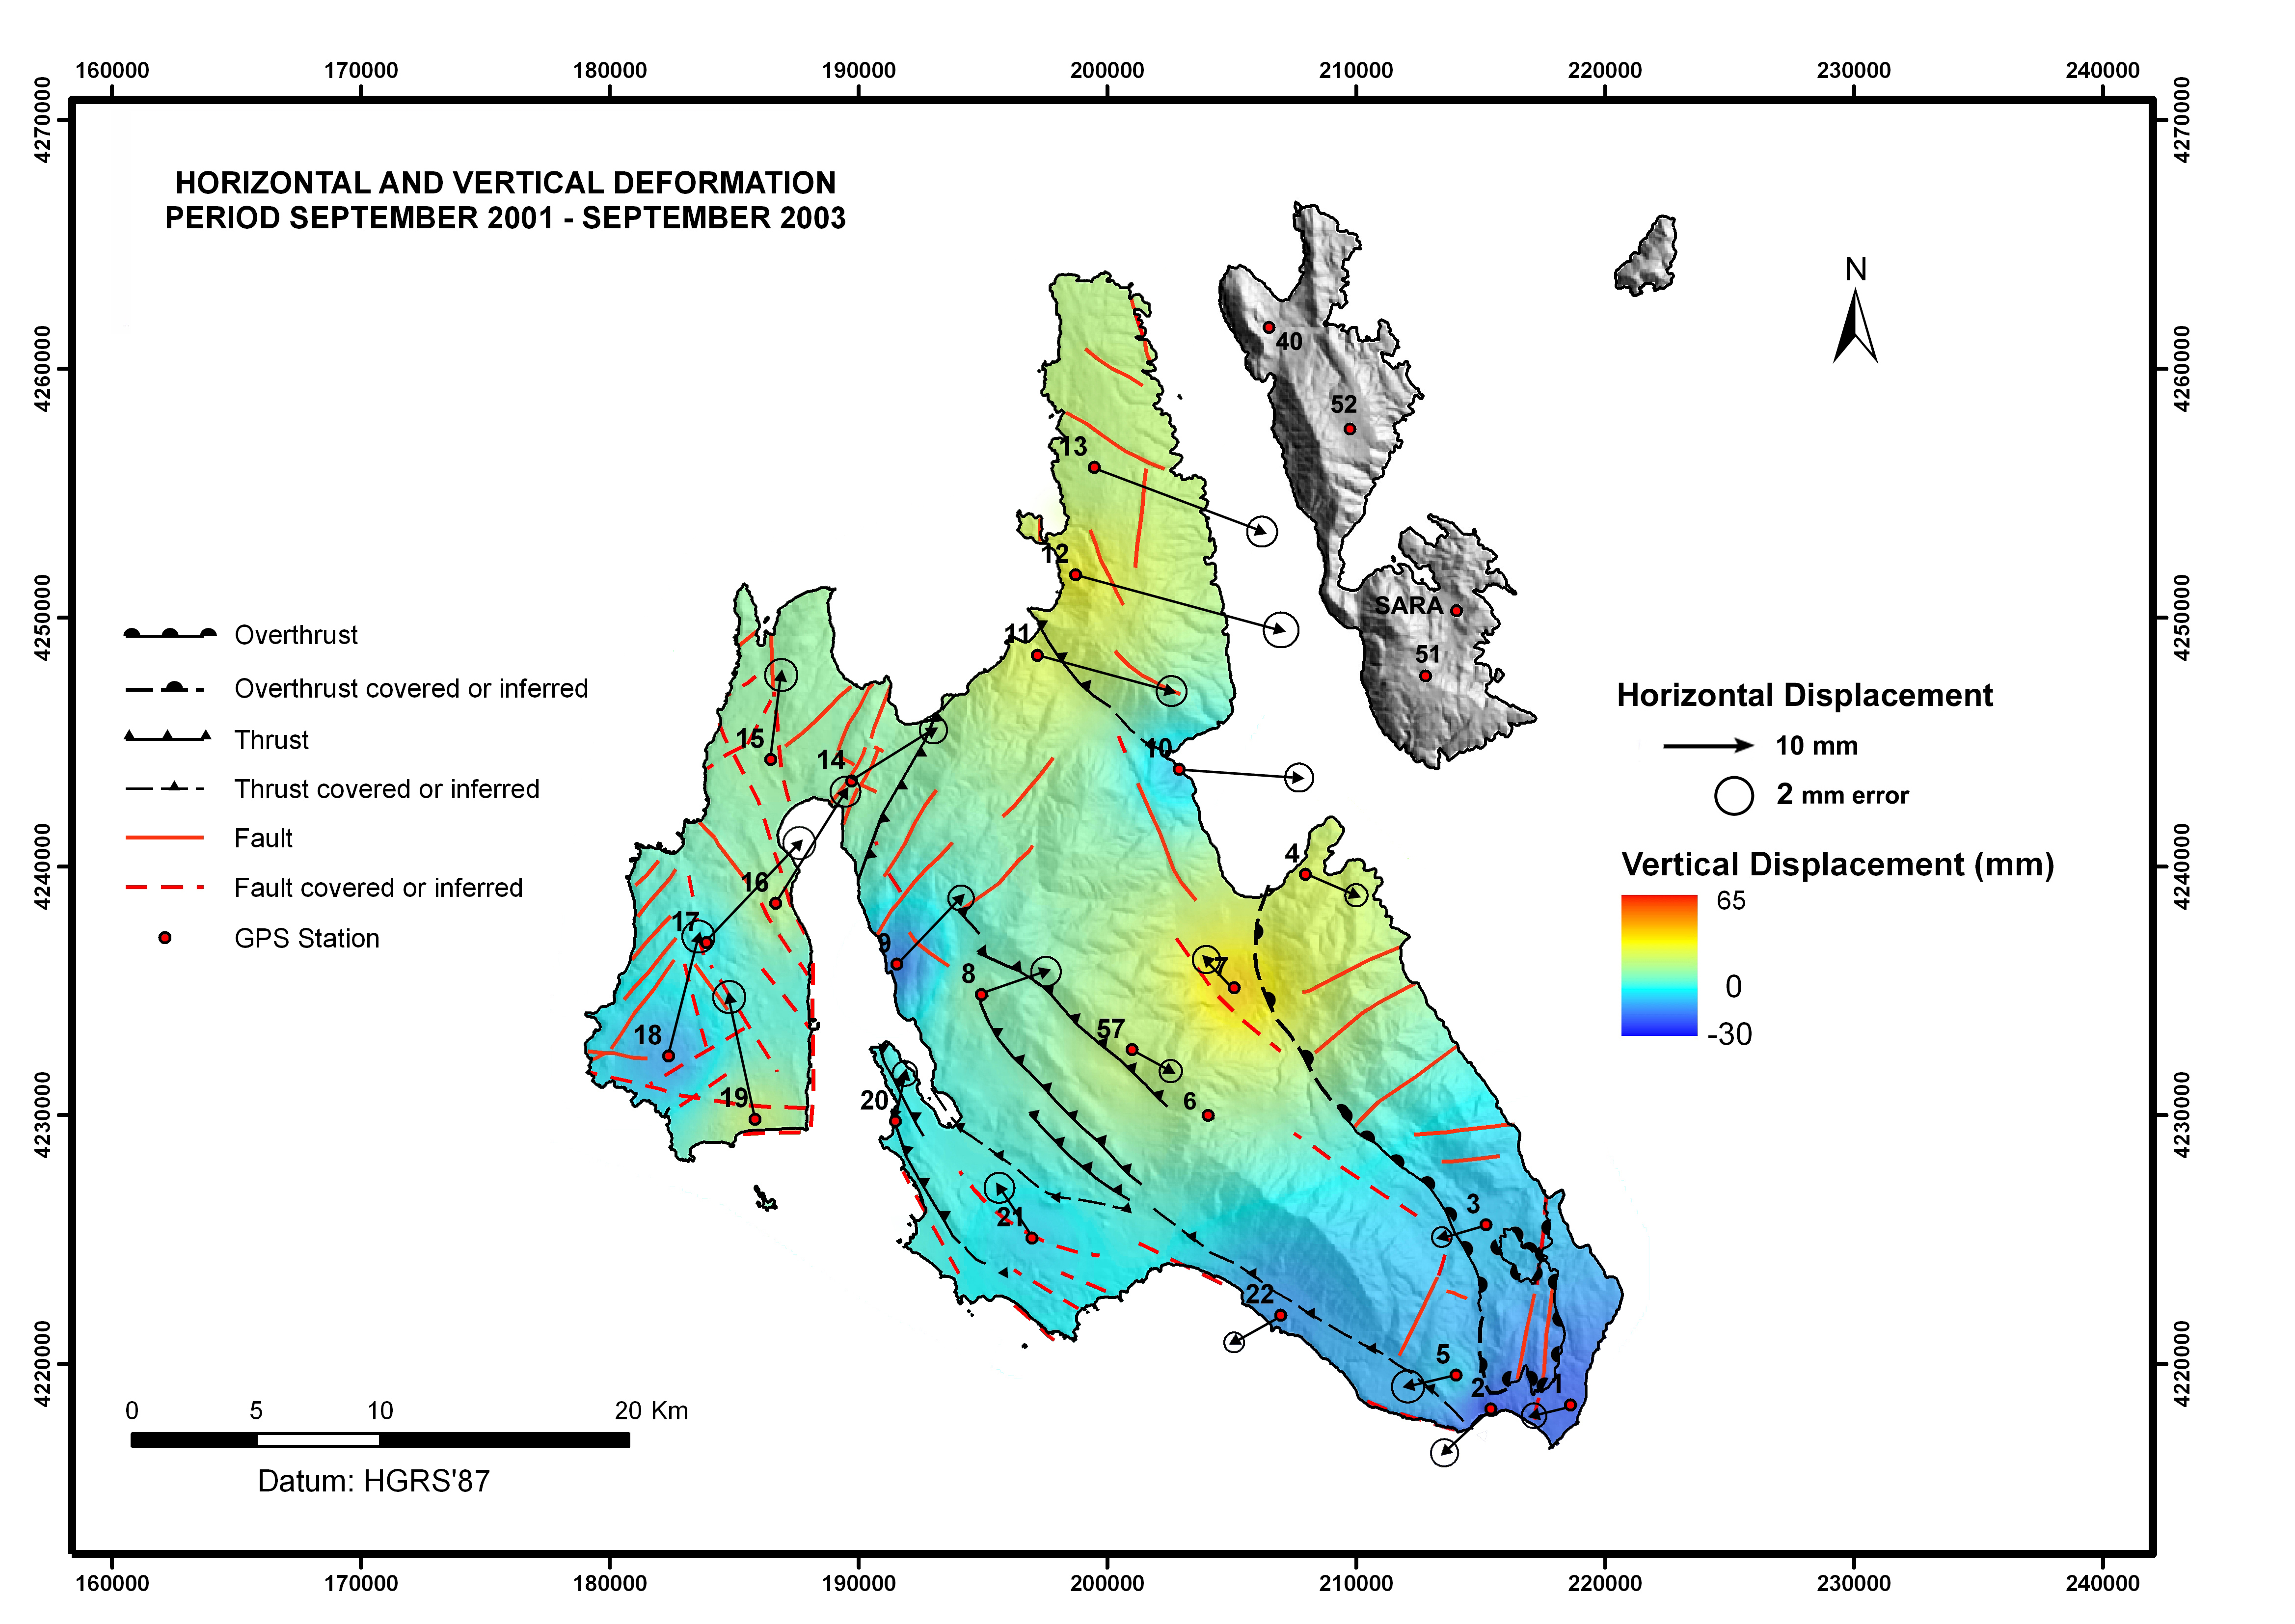
The ground deformation of Cephallonia (Oct. 2001-Sept. 2003) is given. Horizontal displacements that occurred had magnitudes less than 20mm for the majority of stations and a clockwise rotation relative to Aenos mountain can be observed. Subsidence occurred along the southern and SE parts (e.g., Skala area). Small uplift of about 10 mm occurred at the northern and western parts of the island, while more intense uplift (>15 mm) appeared in the eastern part.
Ground Deformation Map of Cephallonia Island (Sept. 2001 – July 2006)
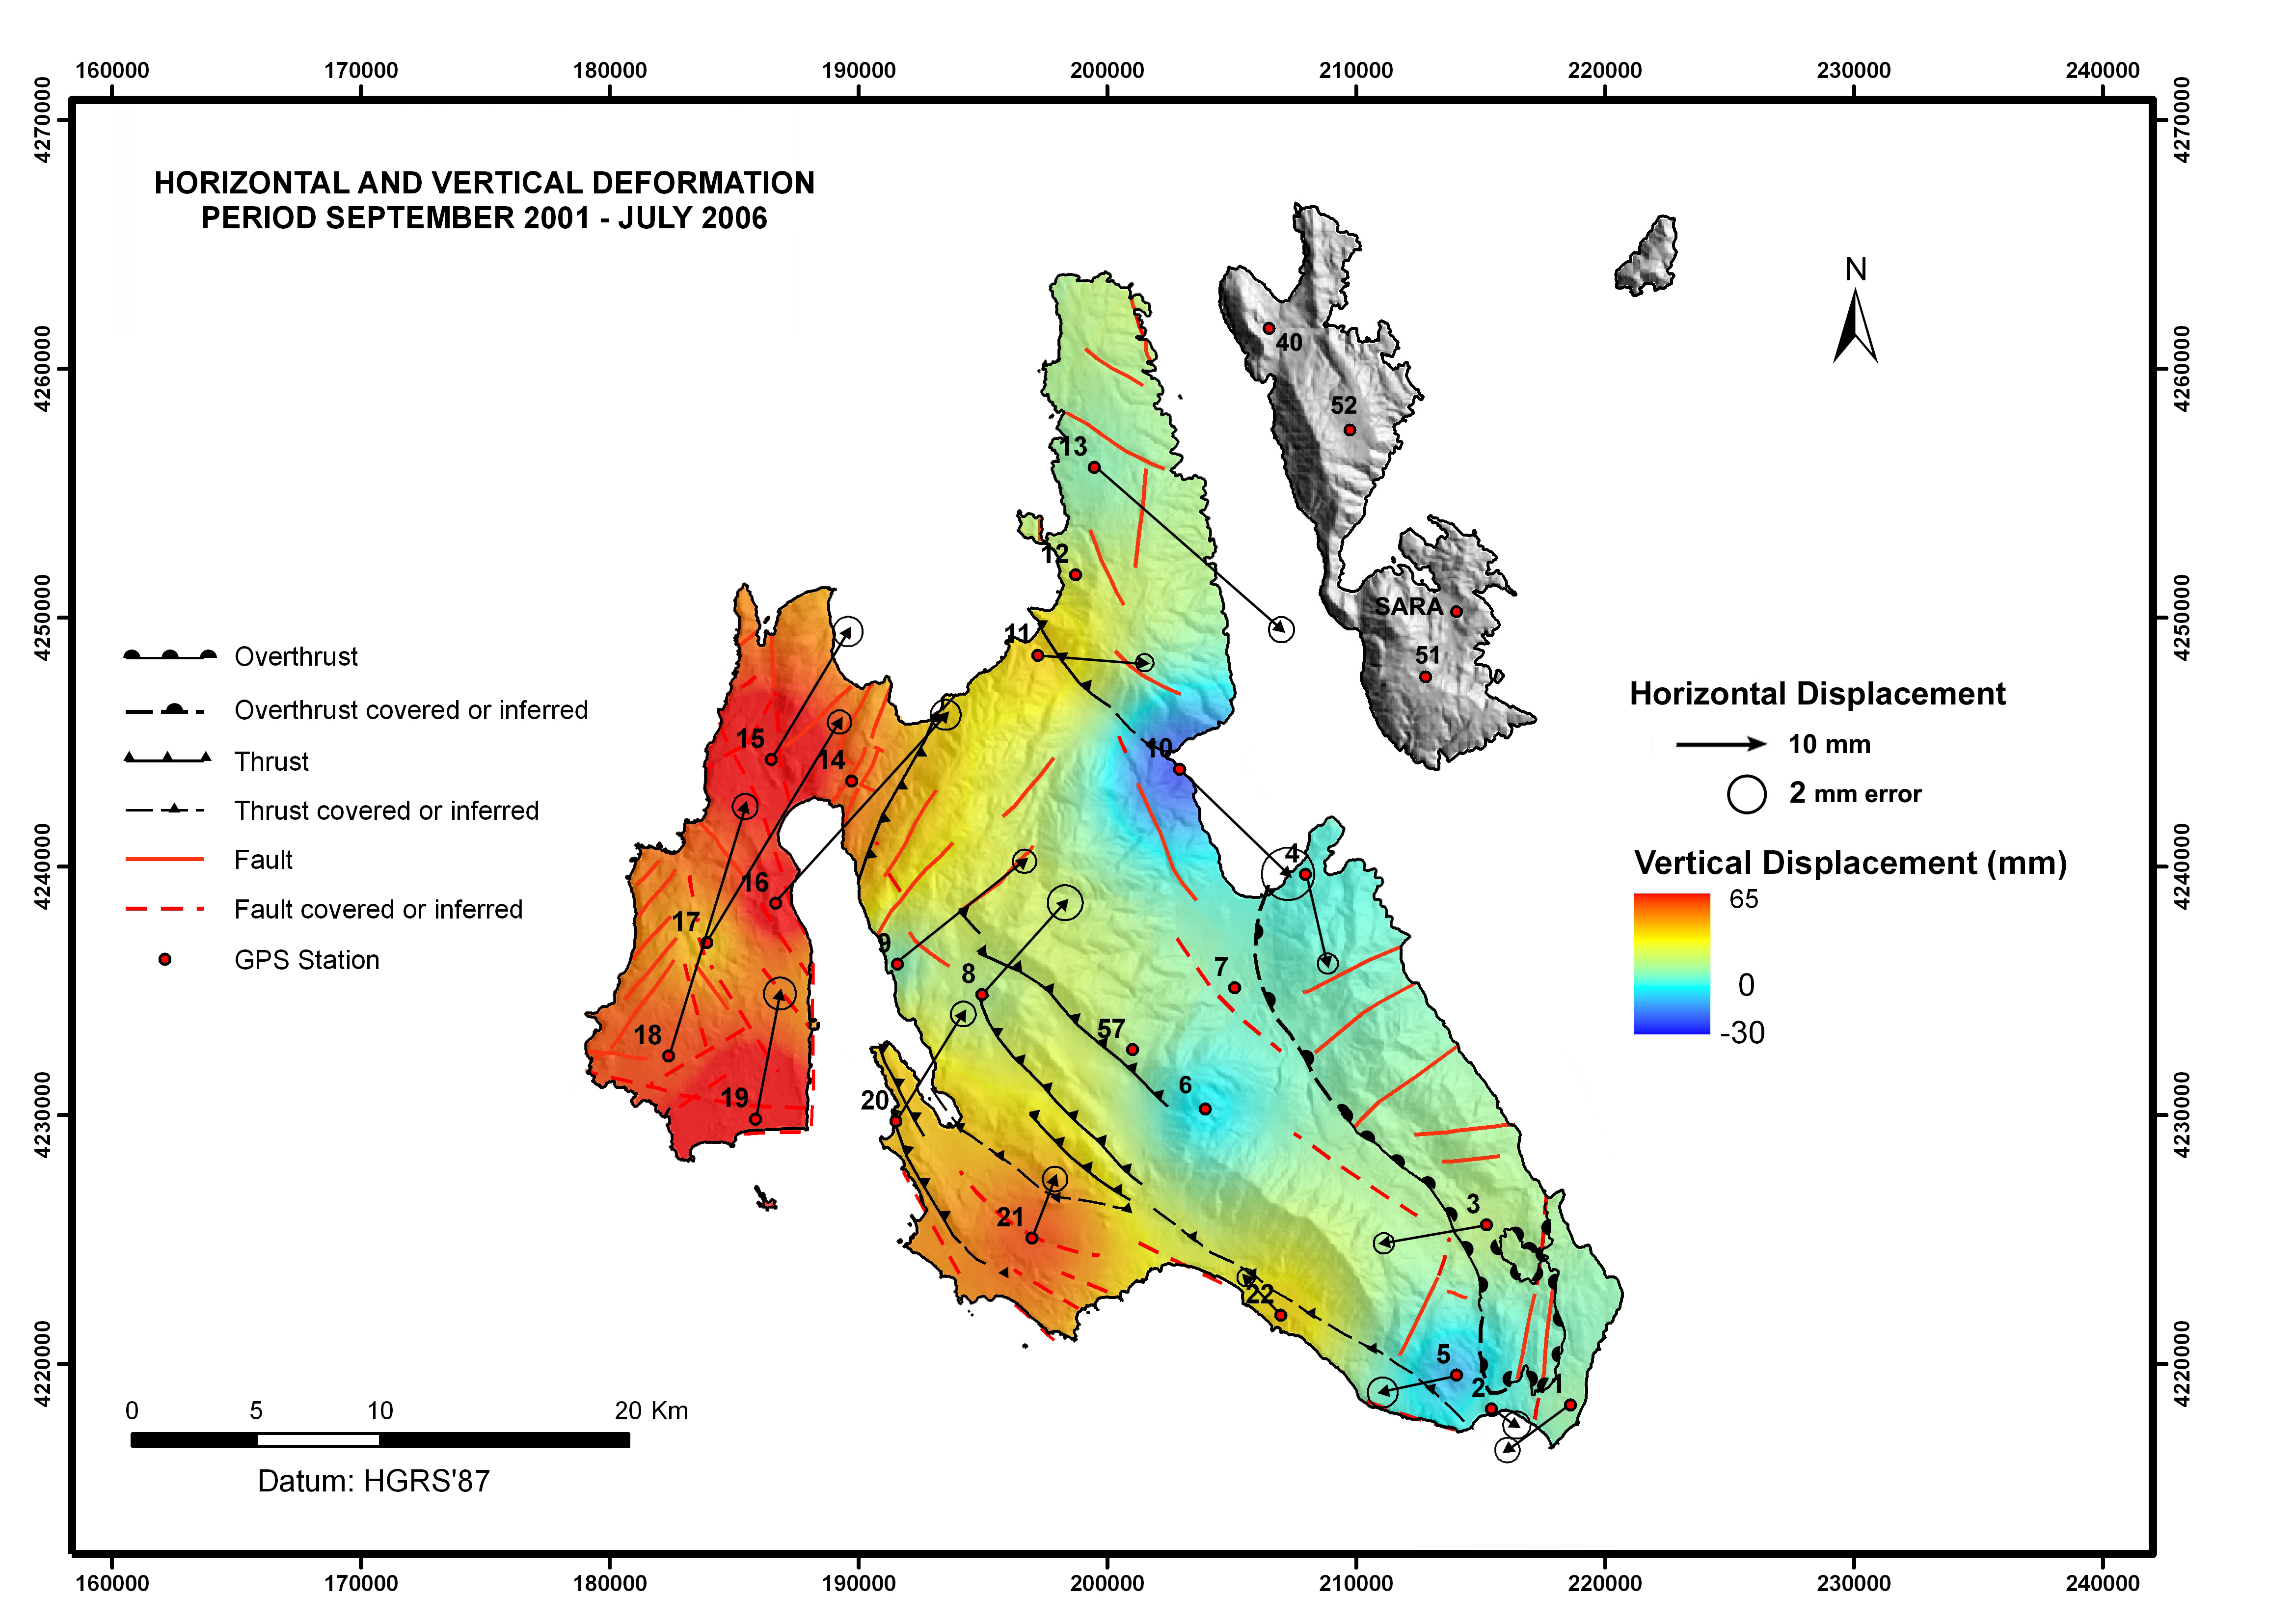
The ground deformation of Cephallonia (Sept. 2001-July 2006) is observed. The horizontal deformation confirms the clockwise rotation that appeared in the first two periods of observations. A very strong uplift at the western and southern parts of the island can be observed, whereas subsidence occurred along the SE parts and around the station 10 at the east-northeast. Uplift with smaller magnitudes is observed at the rest of the island.
Terrain Analysis
Morphological Map of Cephallonia Island (Fig.30)
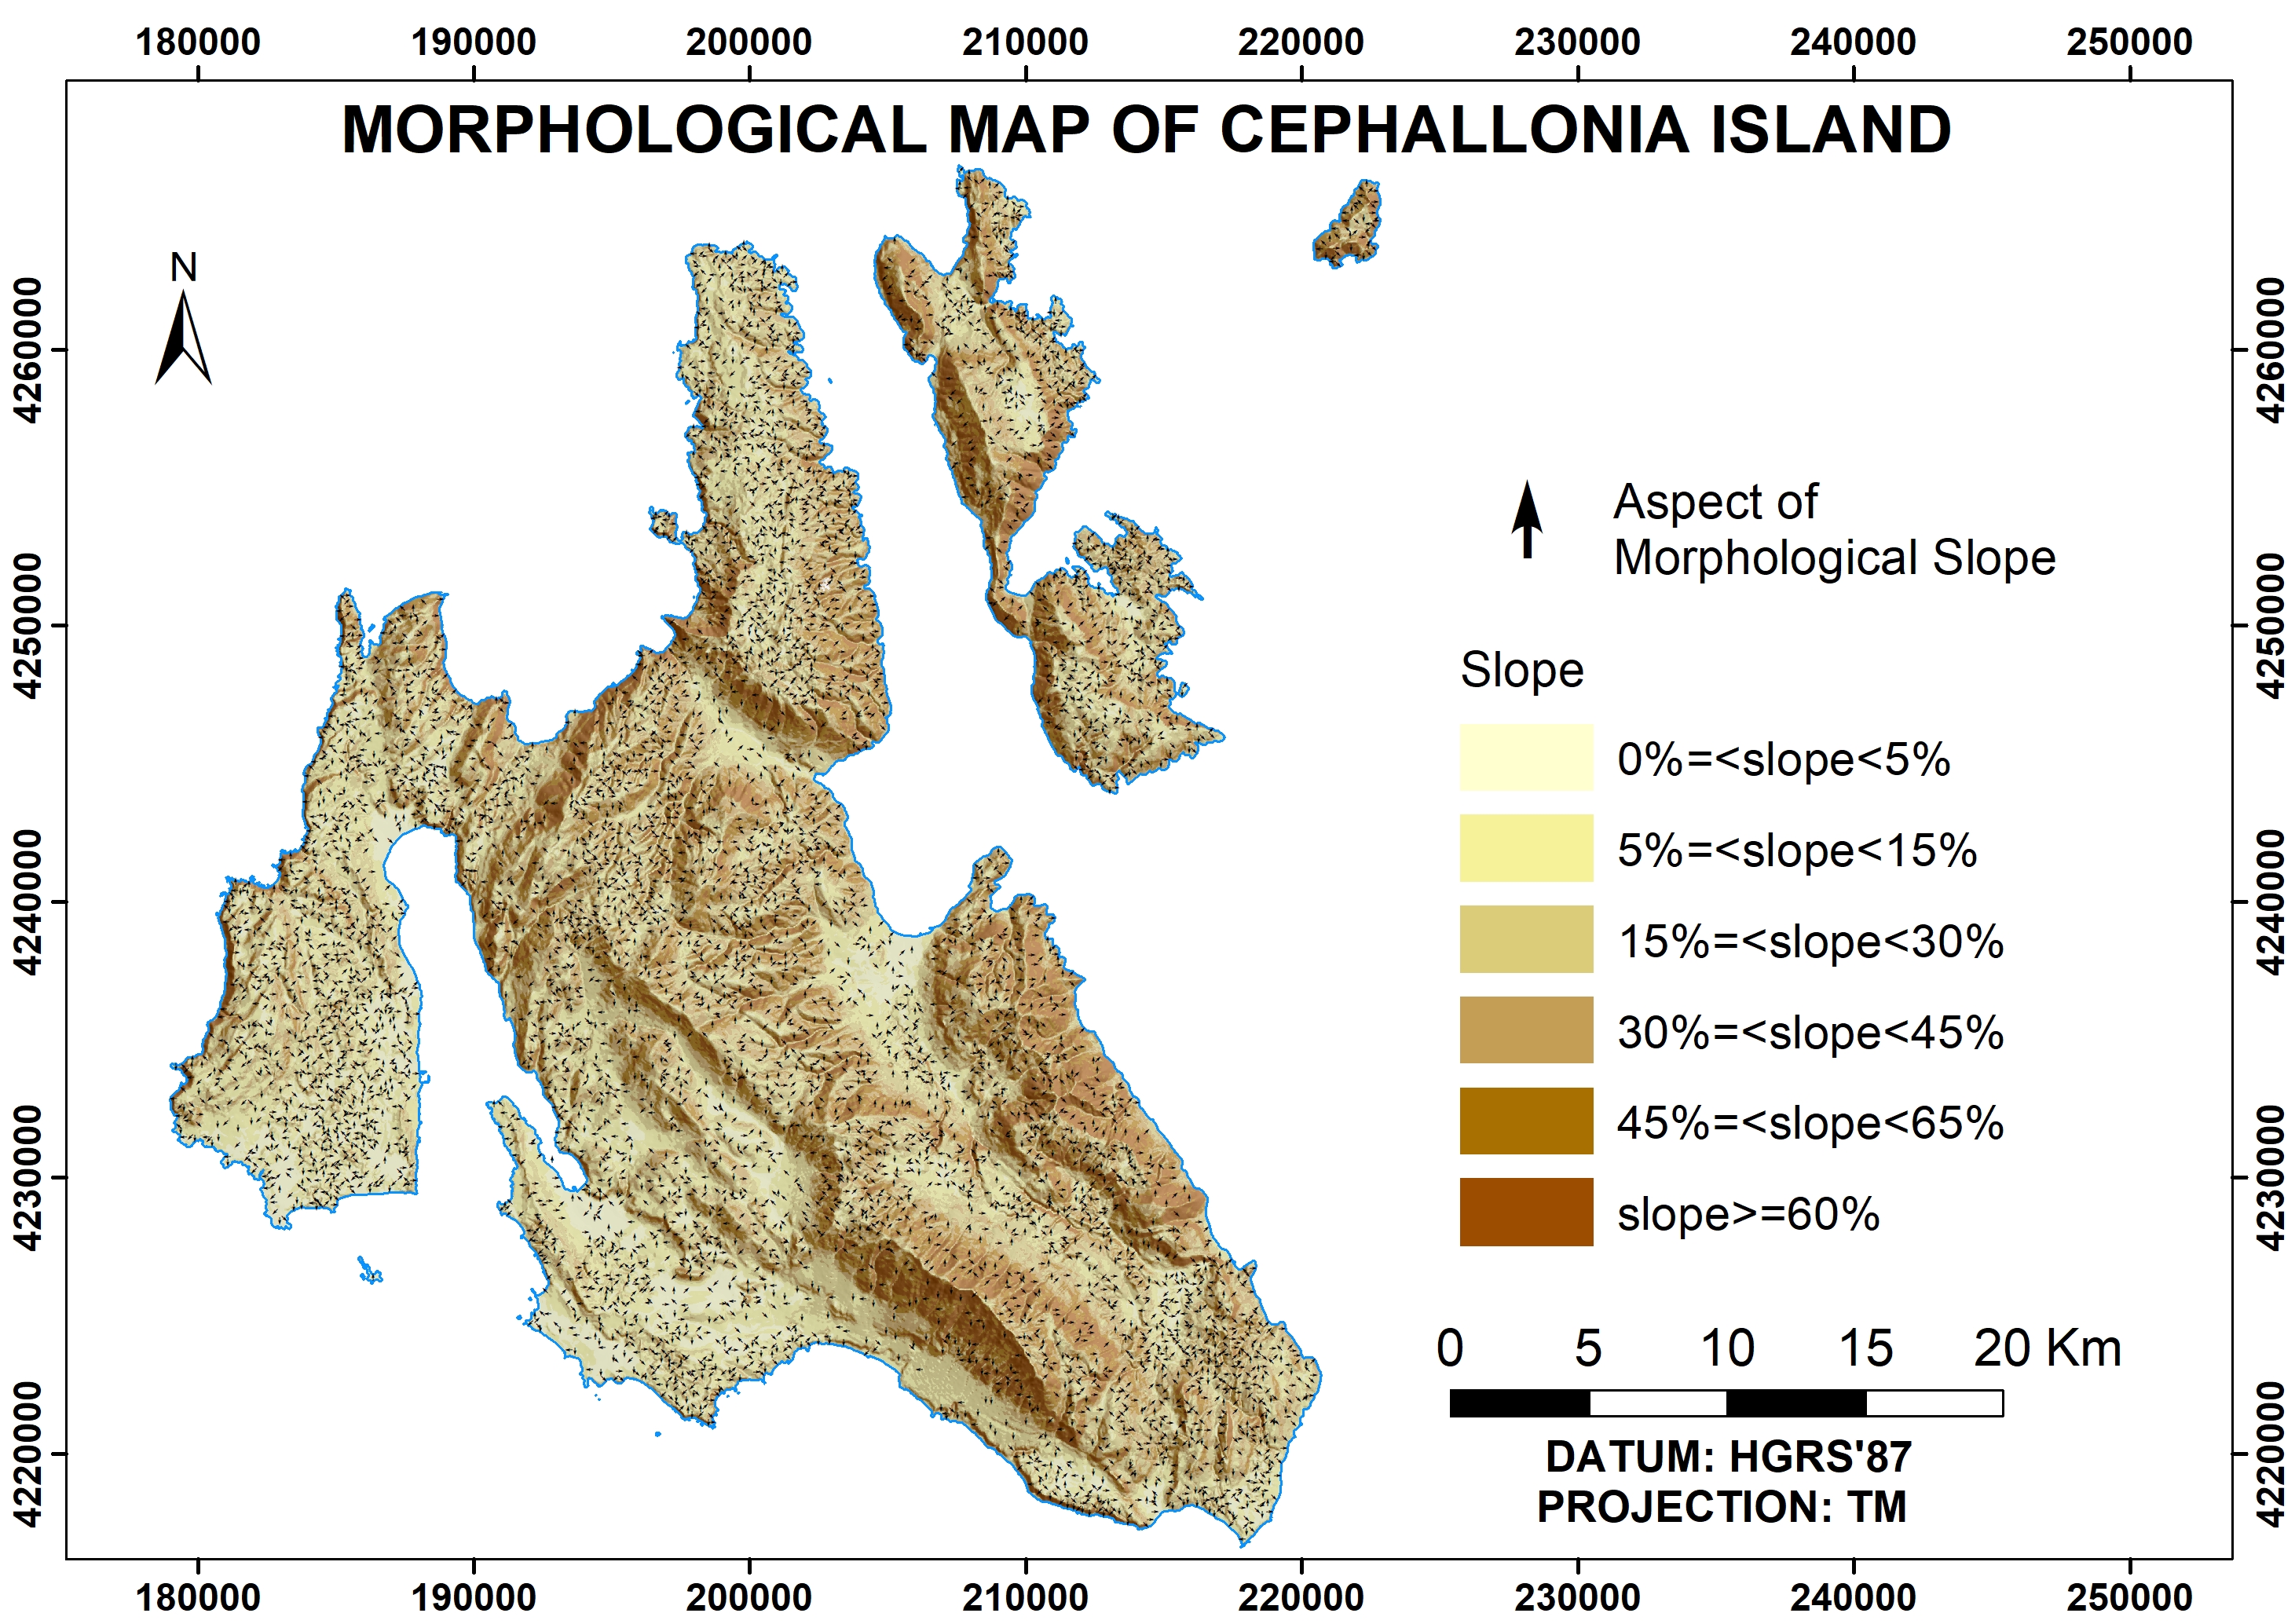
The slopes and the aspect of the slopes are observed. Generally, the terrain is characterized as rough.
References
Vassilopoulou, S., Chousianitis, K., Sakkas, V., Damiata, B.N., Lagios, E., 2007. “GIS development for ground deformation data management. A case study in Cephallonia island (Western Greece)”, Proc. Geological Society of Greece, 2007, 40, 4, 2070-2081.
Lagios, E., Sakkas, V., Papadimitriou, P., Parcharidis, I., Damiata, B.N., Chousianitis, K., Vassilopoulou, S. 2007. “Crustal deformation in the Central Ionian Islands (Greece): Results from DGPS and DInSAR analyses (1995-2006) “ Tectonophysics, 444 (1-4), pp. 119-145. DOI: 10.1016/j.tecto.2007.08.018
Sakkas, V., Lagios, E., 2015. “Fault modelling of the early-2014~ M6 Earthquakes in Cephalonia Island (W. Greece) based on GPS measurements” Tectonophysics,644,184-196, Elsevier. DOI 10.1016/j.tecto.2015.01.010.
Sakkas, V., Lagios, E. 2017 “Ground deformation effects from the~ M6 earthquakes (2014–2015) on Cephalonia–Ithaca Islands (Western Greece) deduced by GPS observations” Acta Geophysica,65,1,207-222, Springer International Publishing, DOI: 10.1007/s11600-017-0017-x).