Georgios Vasilopoulos
Astrophysicist at National and Kapodistrian University of Athens

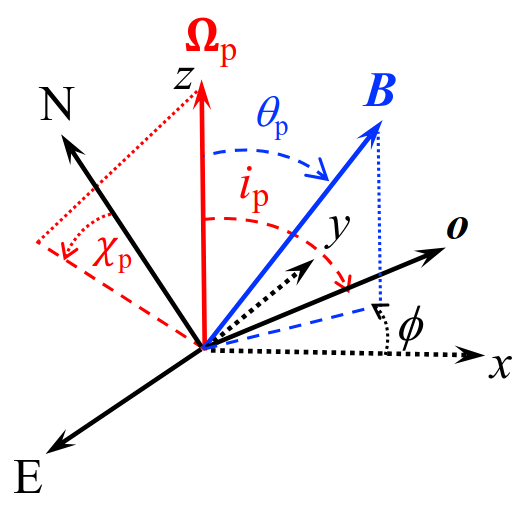
In this page you may experiment with a Rotation Vector Model (RVM).

θp is the angle between rotationa axis and magnetif field and ip
the angle between rotationa axis and observer (image credit: [Fig 4; Doroshenko et al. 2023]).
Examples
1) You may plot data from FRB 20221022A (download csv), obtained from the original paper
[Fig 2; Mckinven et al. 2025].
The first column is time in ms so one needs to phase fold the data with the period slider.
2) You may directly plot data from IXPE polarization values of RX J0440.9+4431 (download csv / credit: Semeli Peimanidi, thesis project).
The first column is phase [0:1] so one needs to fix period to 1 to obtain a meaningfull plot.